
This is an old revision of the document!
Table of Contents
Body/Fuel Type Demand
One of the most important reports in the game is the Body/Fuel Type Demand report. This report contains the popularity of vehicle types and fuel types. You should periodically check this report to see if a vehicle type you're looking to design is popular enough to sell.
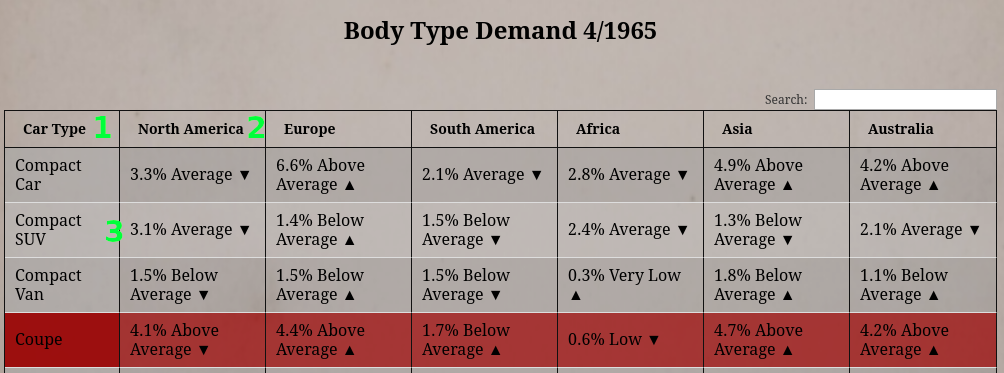
The first column of the table shows the vehicle type (#1), and the remaining columns (#2) are the regions of the map.
Each vehicle type has a value for each region (#3). The numbers represent the raw popularity of the vehicle type. The numbers for all vehicles types in a column should add up to 100%. The words in the cell denote how popular this vehicle type is when compared to the other types. Finally, the arrow signifies if the vehicle type is gaining or shrinking in popularity.
Remember, you can sort the table by clicking the column headers.
Fuel Demand
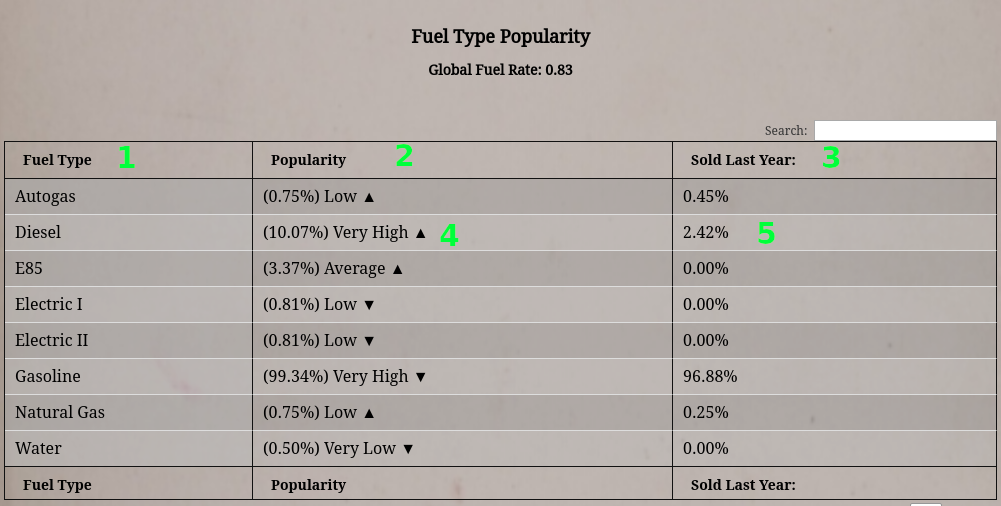
The Fuel Type Popularity table is at the bottom of the Body/Fuel Type Demand report. This table is important to look at when choosing which type of fuel you want your designs to use.
The type of fuel is listed in the first column (#1), followed by how popular it is (#2), and the fuel type's market share (#3).
Each entry displays a raw percentage value (#4) which signifies the percentage of the population interested in that fuel type. The table also includes a text indicator to compare how popular this fuel type is against its peers. And finally, the entry includes an arrow to show if the popularity is going up or down.
Both the body and the fuel type popularities change based on historical trends and player interaction. You and AI manufacturers can greatly alter history by increasing the market share of body and fuel types.
For example, if 4% of all vehicles sold in the game world are Diesel, and Diesel’s popularity value is 2%, the popularity value of Diesel will increase at a faster rate, thus increasing sales of Diesel designs.
Labor Skills
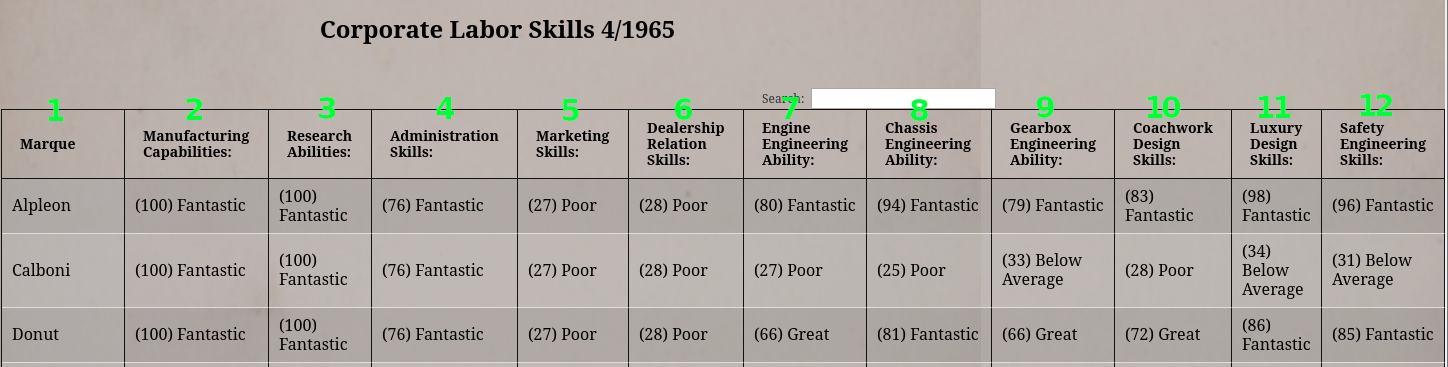
The Corporate Labor Skill report displays all the marques you own and their labor skills. Each skill rating corresponds to the actions your company takes. And they increase the more frequently or better you do at the actions.
| Name | Description | Effects | Improved By |
|---|---|---|---|
| Marque | This is the name of the marque. | - | - |
| Manufacturing Capabilities | This value is their ability to manufacture units. | The number of vehicles built per production line. Vehicle Quality Rating. | It is improved by heavy utilization of Factories for extended periods. |
| Research Abilities | This is how well the company can do research and development. | Combines with component type-specific design skills designs take to provide bonuses to ratings. It also has a small effect on development time and the Manufacturing and Design requirement ratings. | Improve it by designing more things and spending more money on Research Teams. |
| Administration Skills | These are how well your white-collar workers and upper and middle management perform their jobs. | It helps when negotiating with Unions, reduces the margin of error for estimations of values such as missed sales. And it increases the number of new dealerships that will sign with you when subsidizing new dealers. | Improve it by building more branches and keeping branch and administrative morale high. |
| Marketing Skills | This is how well the marketers at the company do their job. | It increases the marketing efficiency rate growth, which improves vehicle buyer ratings. | Improve it by spending more money on marketing over long periods and keeping marketing employee morale up. |
| Dealerships Relation Skills | The skill is how well the company can sign and retain dealerships. | The higher this skill is, the more dealerships will sign up with your branches. The more dealerships you have, the more sales. | Improve it by building more branches with high dealership resources and keeping branch and administrative morale high. |
| Engine Engineering Ability | This is how well their engineers can develop engines. | This skill improves many engine ratings. | This rating improves by the average overall design ratings of all engine designs you've completed in the last 5 years. The rating also improves with Research Team funding and Racing Development. |
| Chassis Engineering Ability | This is how well their engineers can develop chassis. | This skill improves many chassis ratings. | This rating improves by the average overall design ratings of all chassis designs you've completed in the last 5 years. The rating also improves with Research Team funding and Racing Development. |
| Gearbox Engineering Ability | This is how well their engineers can develop gearboxes. | This skill improves many gearbox ratings. | This rating improves by the average overall design ratings of all gearbox designs you've completed in the last 5 years. The rating also improves with Research Team funding and Racing Development. |
| Coachwork Design Skills | This is how well their engineers can develop vehicles. | This skill improves many vehicle ratings. | This rating improves by the average overall design ratings of all vehicle designs you've completed in the last 5 years. The rating also improves with Research Team funding and Racing Development. |
| Luxury Design Skills | This is how well the company makes luxurious designs. | It improves the luxury ratings of vehicle designs. | This rating improves based on the average vehicle luxury rating for all designs you have completed in the last 5 years. |
| Safety Engineering Skills | This is how well the company makes safe designs. | It improves the safety ratings of vehicle designs. | This rating improves based on the average vehicle safety rating for all designs you have completed in the last 5 years. |
Chart
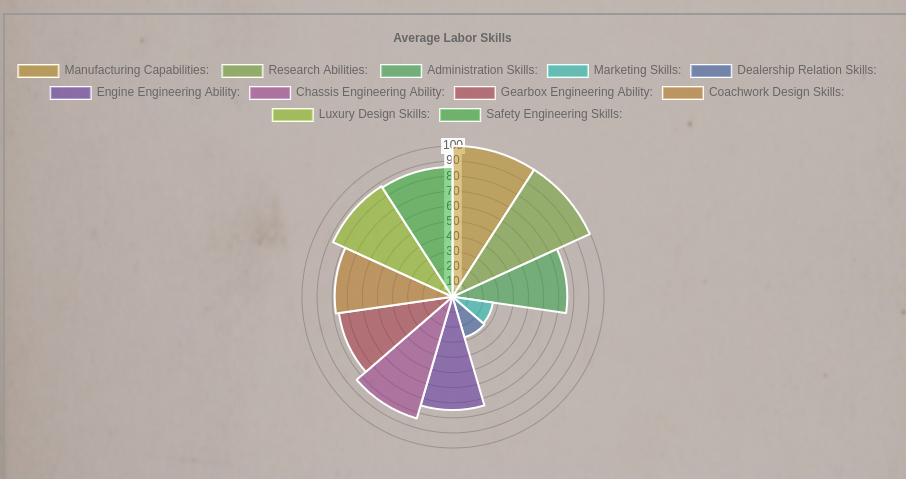
This report also contains a radar chart displaying all skills and their values. Above the graphs are colored blocks. These blocks correspond to the colors on the graphs. You can click these blocks to toggle the display of this category in the chart.
Prestige/Image
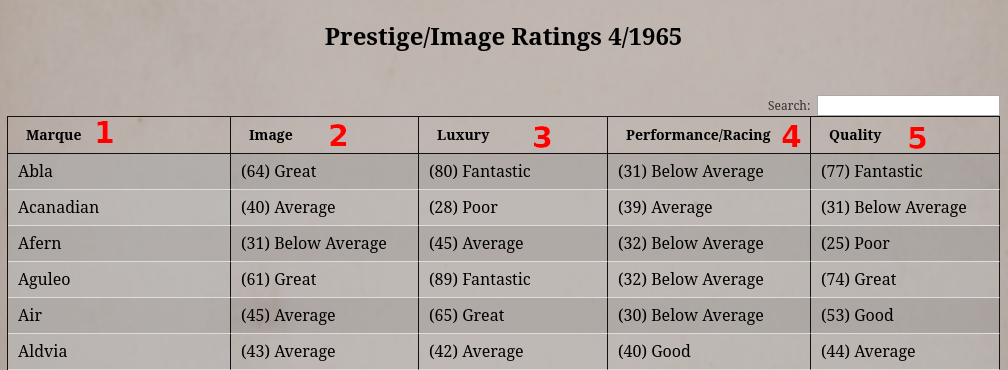
The Prestige/Image report shows how the public view certain parts of a company. The report lists every active company in the table (#1).
The company's overall image rating is found in the “Image” column (#2). The game derives this rating from all other image ratings and marketing. And this rating has a major effect on vehicle buyer ratings.
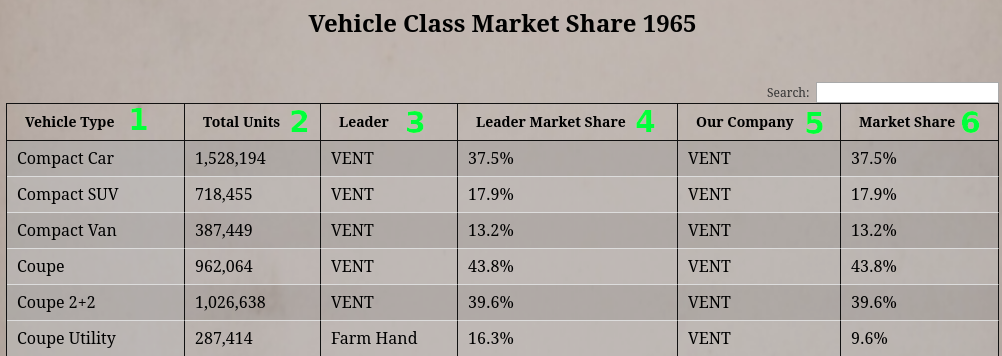
Vehicle Class Market Share
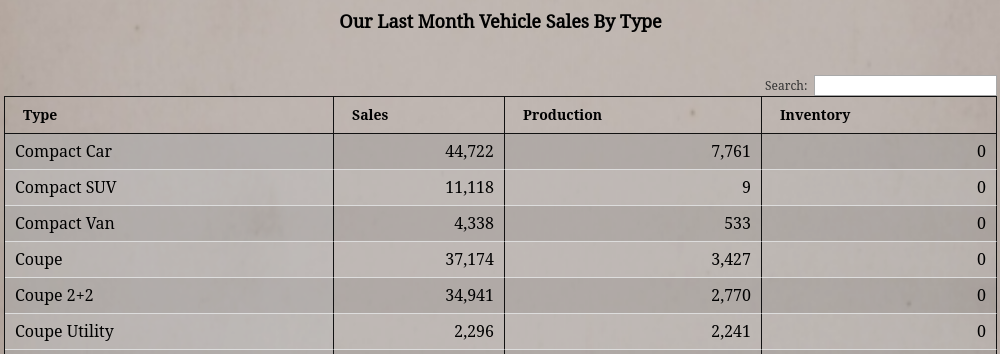
Your Last Month Sales By Type
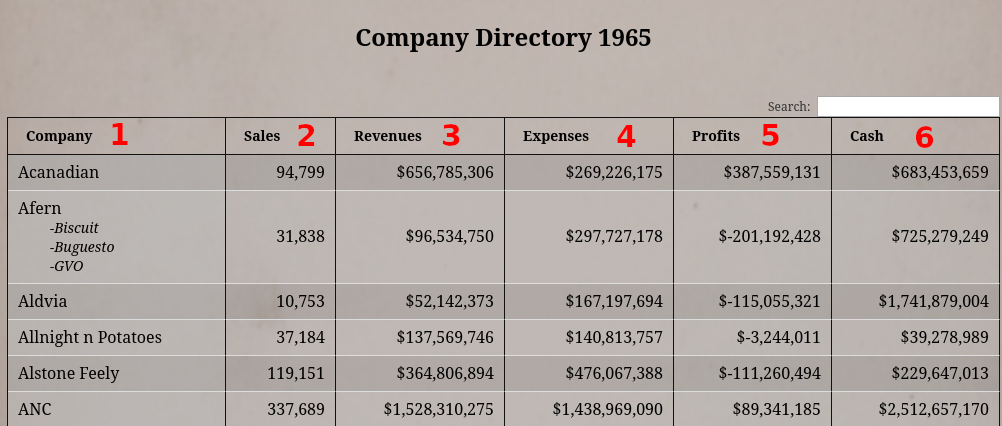
Company Directory
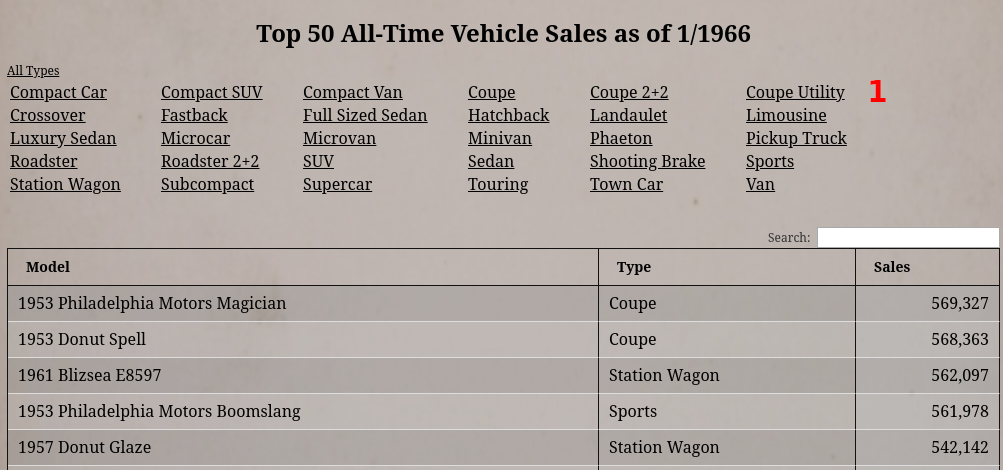
Top 50 All Time Vehicle Sales
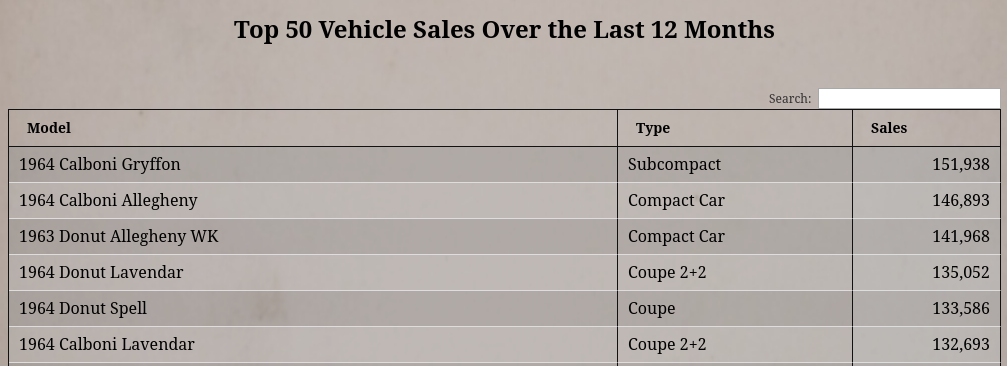
Top 50 12 Months Vehicle Sales
Market Cap Table
See Market Cap Table in the Stock Holdings report.