This is an old revision of the document!
Table of Contents
Revenue Summary
The revenues report contains much of the information that appears in the main Monthly Sales report. But this report also contains a couple of graphs. We break the report down into five sections.
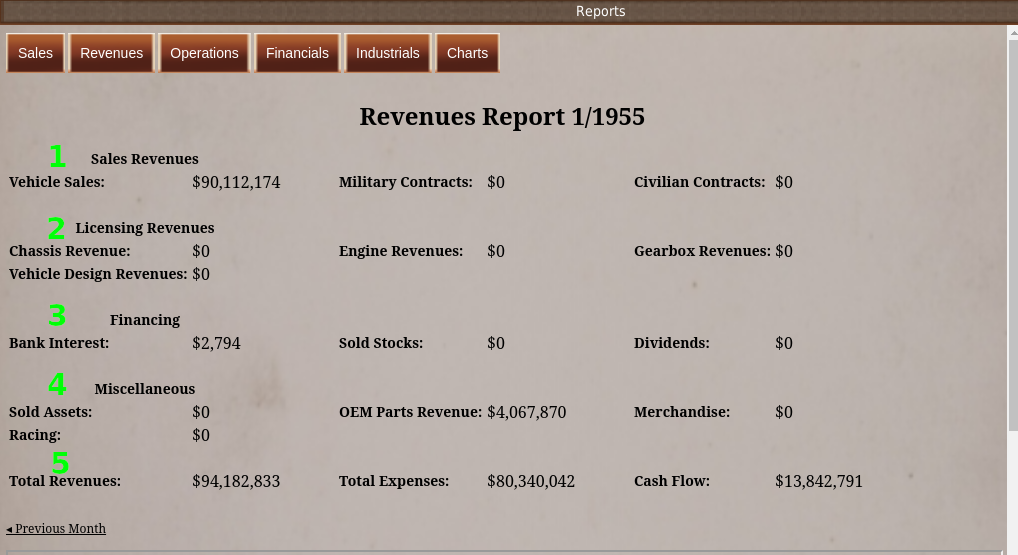
The first section (#1) is sales revenues. This section has your consumer vehicle sales revenues first. Then your military contract revenues. And then your civilian contract revenues.
In the second section (#2), you'll find licensing revenues. These are royalties and signing fees collected from companies licensing your designs. These revenues do not include outsourcing contracts. You will find outsourcing revenues in the Civilian Contracts section.
The Financing section (#3) contains bank interest from your cash funds. It also has any revenues you made from selling stocks or collected in dividends.
The Miscellaneous section (#4) contains revenues from sold assets, like factories. OEM parts revenues that come from vehicles you've sold in the last seven years. Merchandising revenues that come from sales of consumer goods featuring your brands and logos. And finally, racing income.
The final section (#5) shows your total revenues, expenses, and cash flow.
Charts
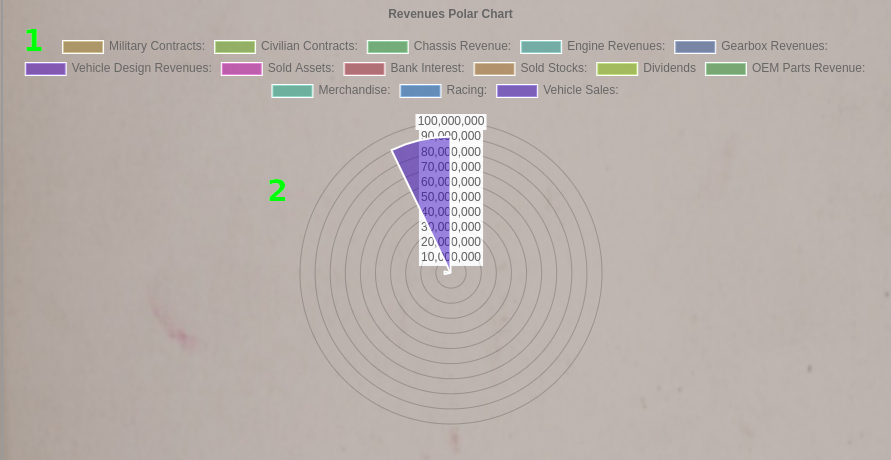
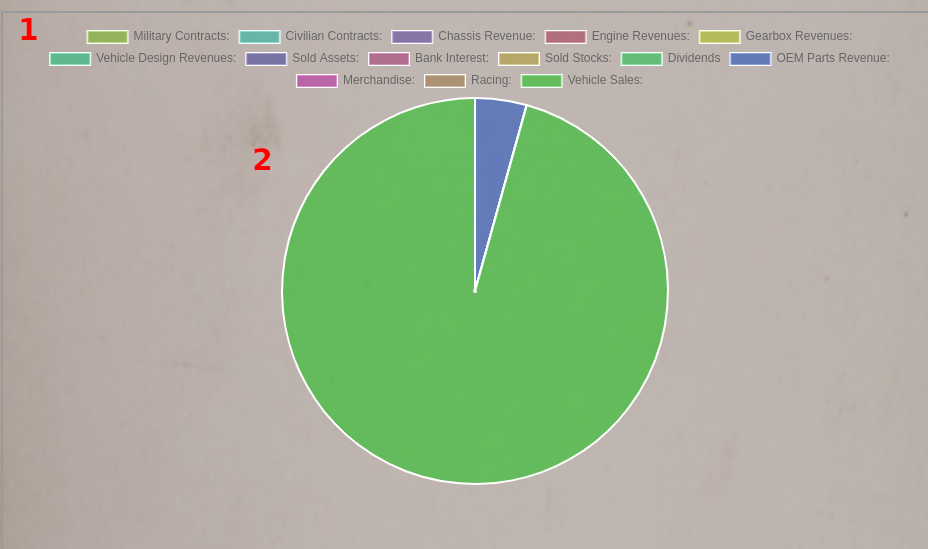
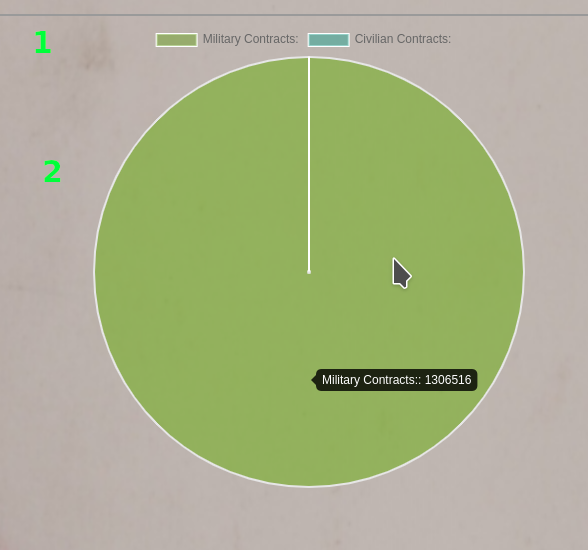
The report also contains two charts, a Revenue Radio Chart and a Revenue Pie Chart. Both charts display all your revenue streams in the graphs (#2). Above the graphs are colored blocks (#1). These blocks correspond to the colors on the graphs. You can click these blocks to toggle the display of this category in the chart.
Licensing Revenues
The Licensing Revenues report contains data on the revenues generated from designs you licensed to other companies.
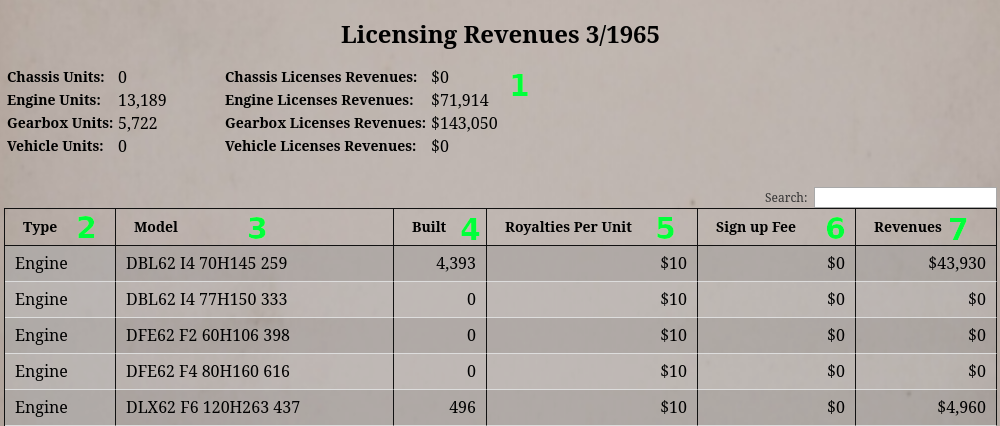
At the top is last month's revenue summation for all designs you have licensed out (#1). This section is broken into two groups. On the left is the number of units other companies built. And on the right are the royalties they paid plus any new license signing bonuses.
The table lists every actively licensed design. The first column is the type of design (#2). Next is the model name of the design (#3). The total number of units other companies built last month is in the “Built” column (#4). This column does not contain units you or your marques built.
Royalties Per Unit (#5) displays the average amount per unit other companies pay for each unit they build. If any new licenses are signed, their signing fee will appear in the Sign Up Fee column (#6). Finally, licensing revenues for this model's last turn appear in the column called “Revenues” (#7).
Charts

The Licensing report has two charts. The first chart is a pie chart that displays licensing revenues by type (#2). Above the chart are colored blocks (#1). These blocks correspond to the colors on the graphs. You can click these blocks to toggle the display of this category in the chart.
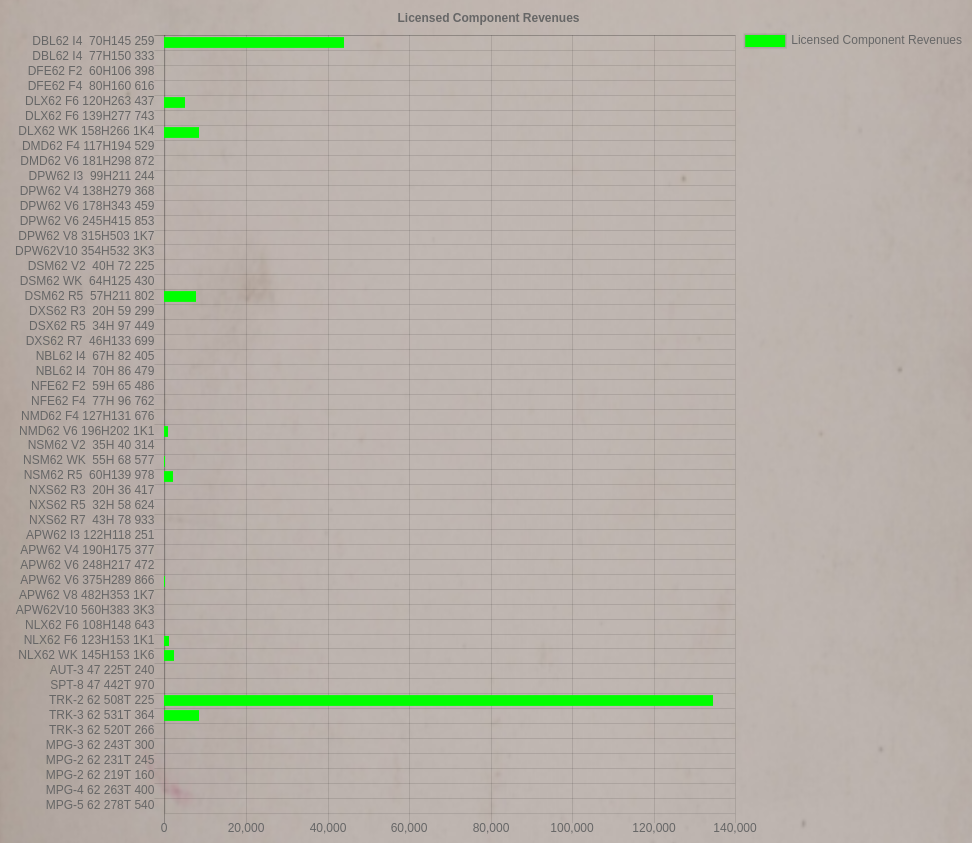
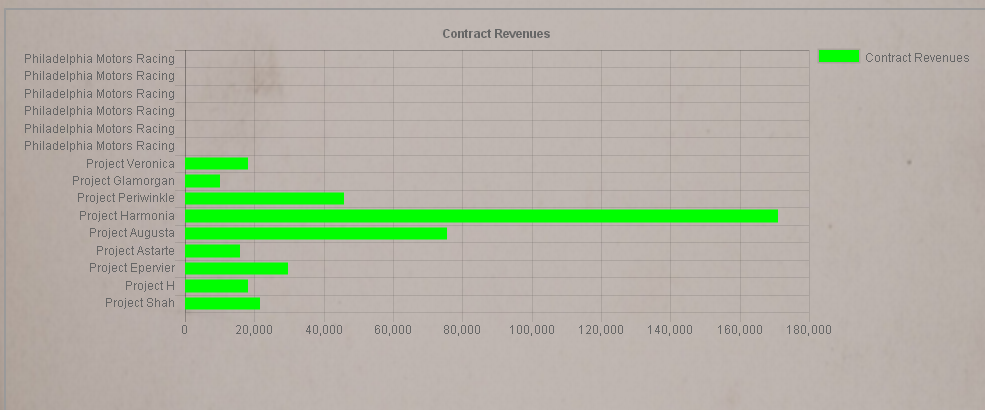
The next chart is a bar graph chart displaying each unit currently licensed out and the revenues you're generating from that unit.
Contract Revenues
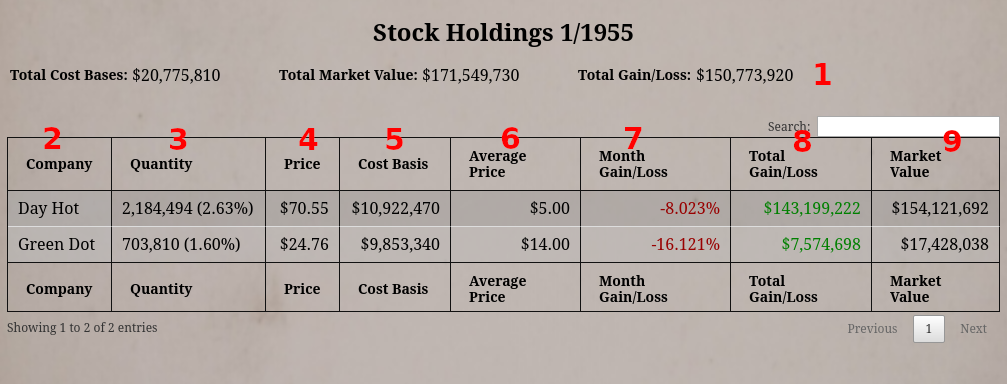
Stock Holdings
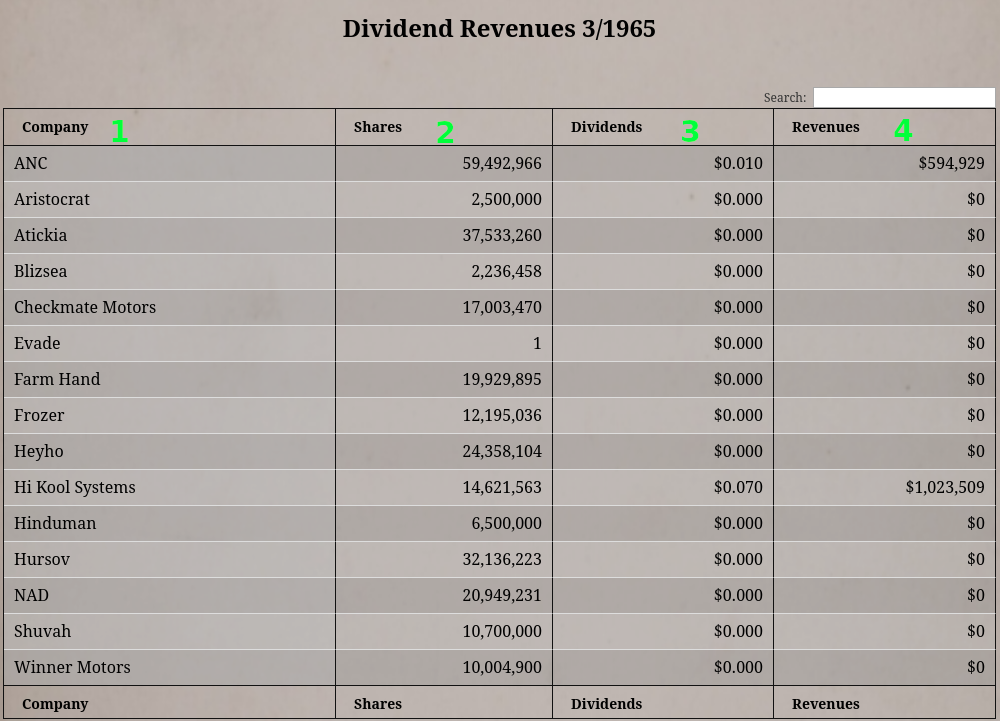
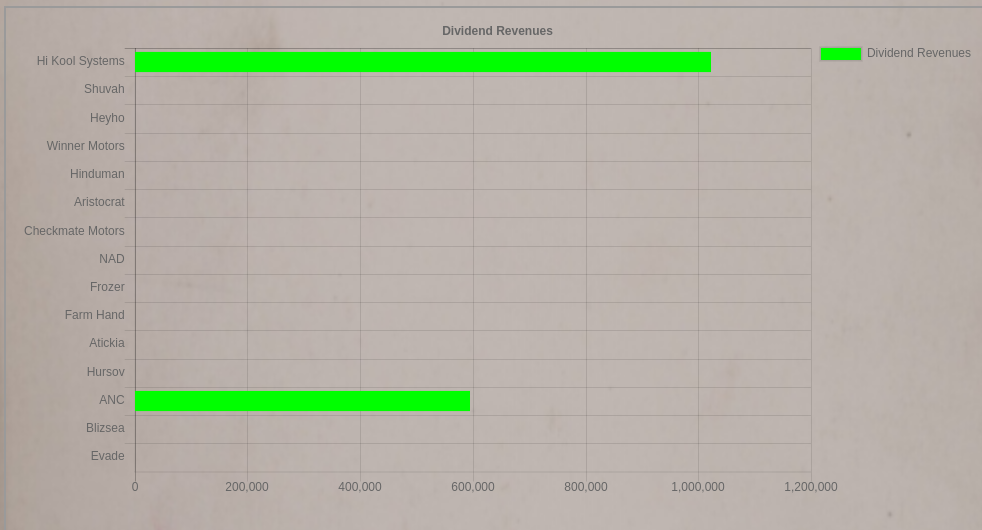
Dividend Revenues