
This is an old revision of the document!
Table of Contents
Dynamic Report Buttons

You can dynamically generate reports throughout the game using a chart button.
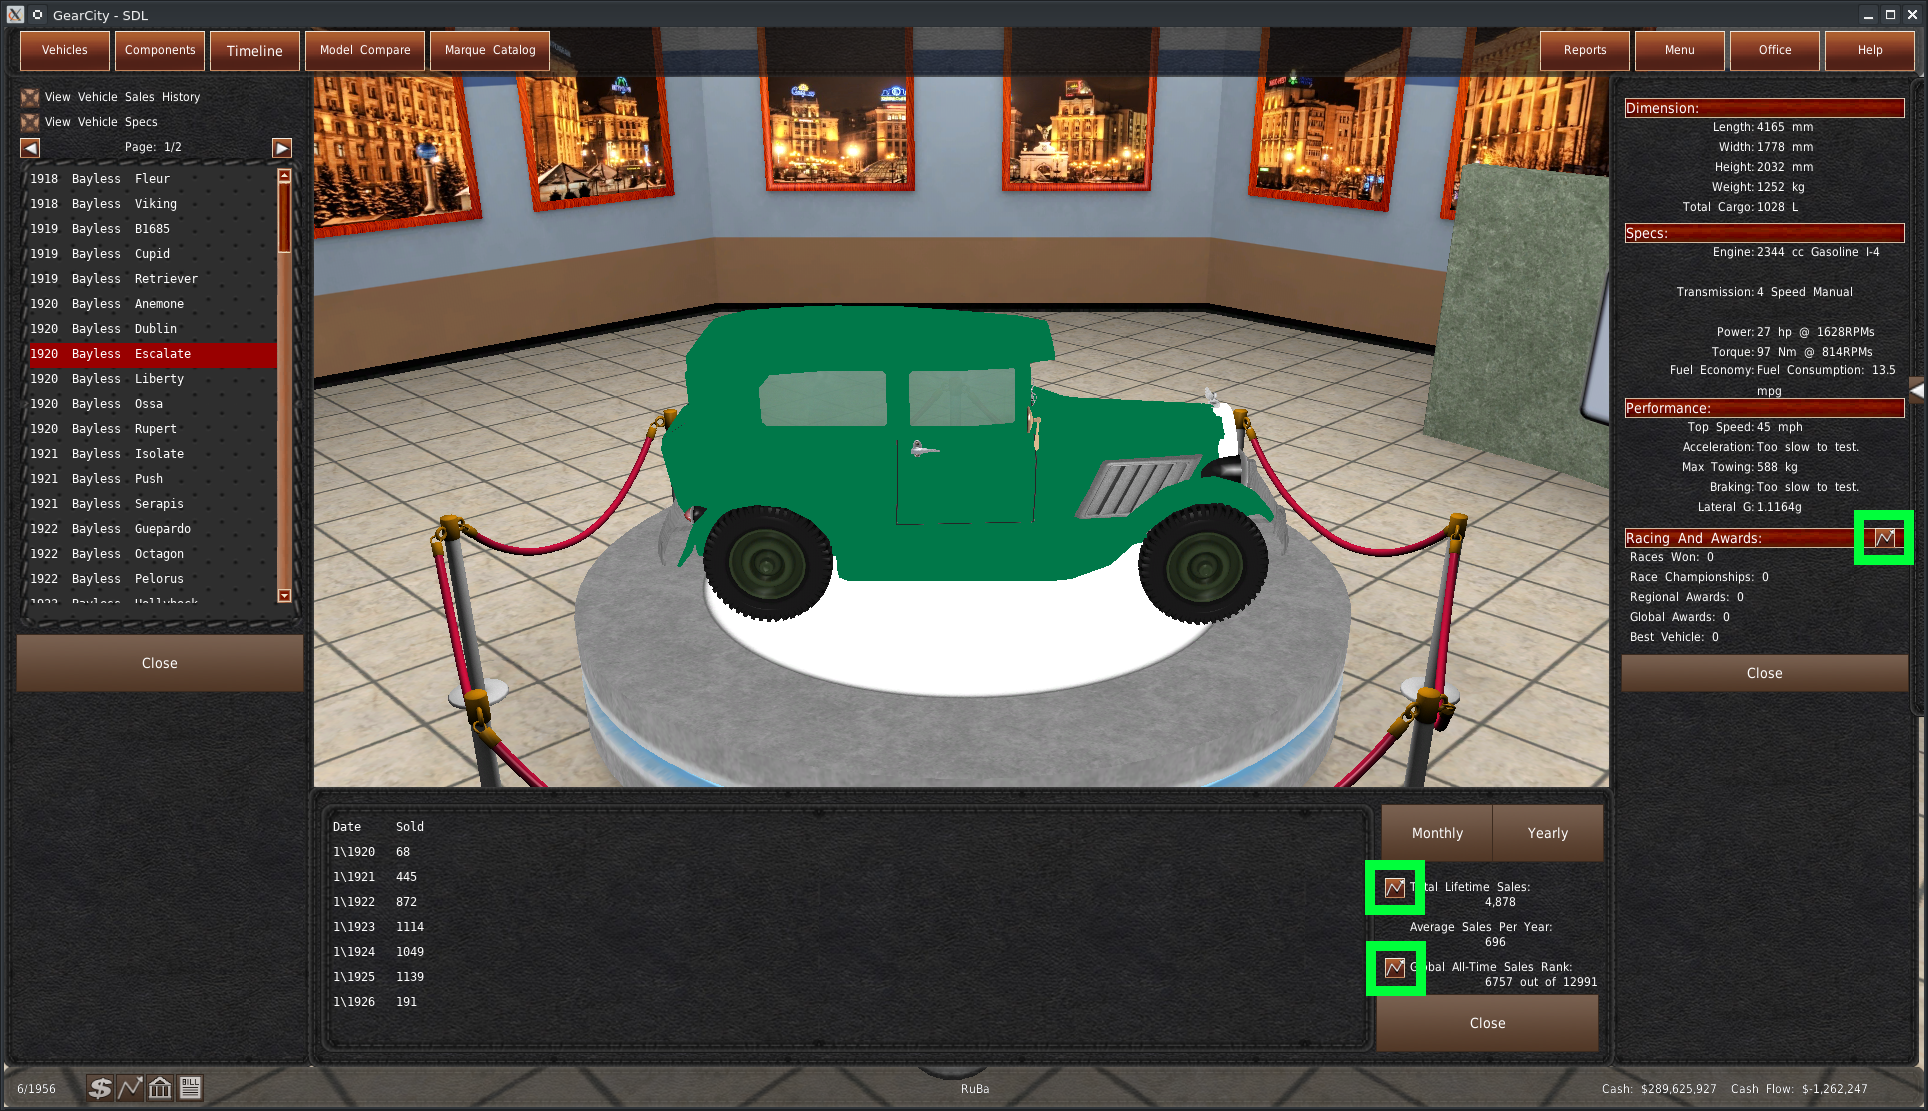
Most of these reports have basic graphs related to the subject the button is near. Here are a few examples:
But there are a few buttons that open extremely important reports. We cover them in the remaining sections of this page.
Wealth Demographic And Buyer Rating Report

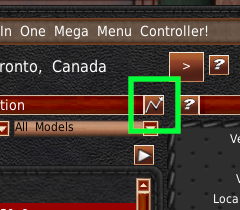
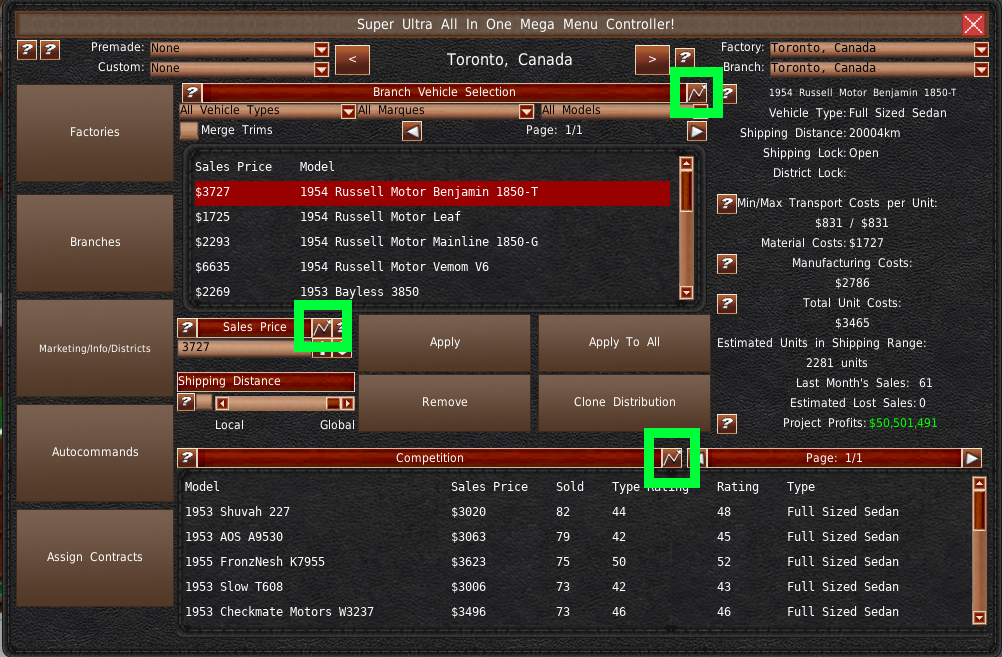
The Wealth Distribution and Buyer Rating Report is one of the most important reports in the game. You can find the dynamic report button for this report next to where you enter a vehicle's sales price in the Branch Distribution system. This is in both the World Map branch system and the Mega Menu.
This button will open a Wealth Demographics And Buyer Rating Report for the selected vehicle in the selected city. It only displays the information for the selected vehicle in the selected city. You will need to generate a new report for any other vehicle or city.
Wealth Demographic Reports
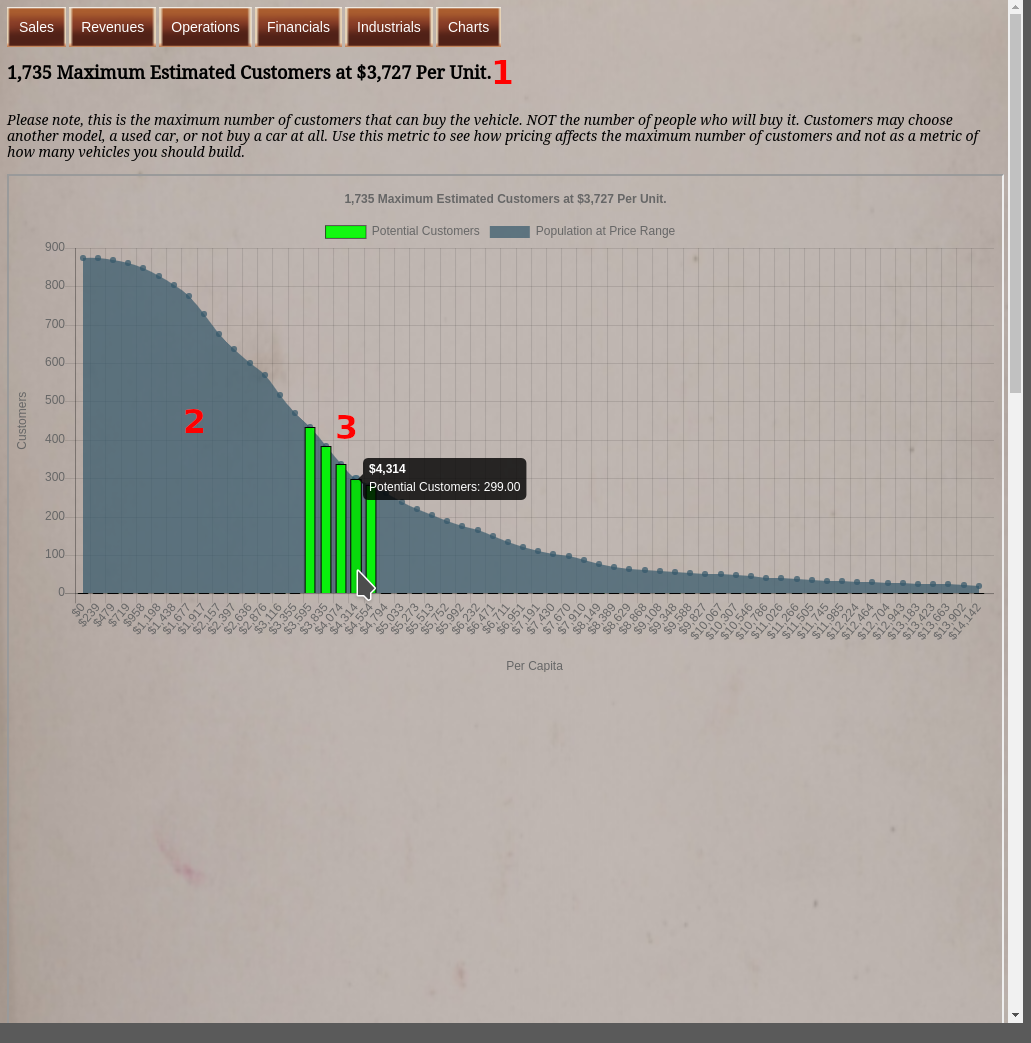
The Wealth Demographics graph is the first section of the report you'll see. This graph breaks down the people interested in buying this vehicle type, in this city, into household income buckets using the blue chart (#2). The number of people is on the Y-axis, and their income is on the X-axis. You can hover over the points to get the specific dollar and population size values.
The bright green bar graphs are the number of people interested in buying a vehicle around the price point of your selected model (#3). Your vehicle is too expensive for the dark blue area to the left of the green bars. And your vehicle is too cheap for the areas to the right of them.
The broader the appeal of your vehicle, the more bars you will have above and below the sales price. The number of bars in the graph changes based on your marketing and image ratings. The better your marketing or image ratings are, the more bars you'll have, thus more people willing to pay out of their price zone for your vehicles.
At the top of this report is the maximum potential customers at your current sales price (#1). This value is only the maximum potential and is not an estimation of your sales. The more green bars you get, the more maximum potential sales you will have.
You can access additional data by scrolling down the report.
Buyer Rating Table
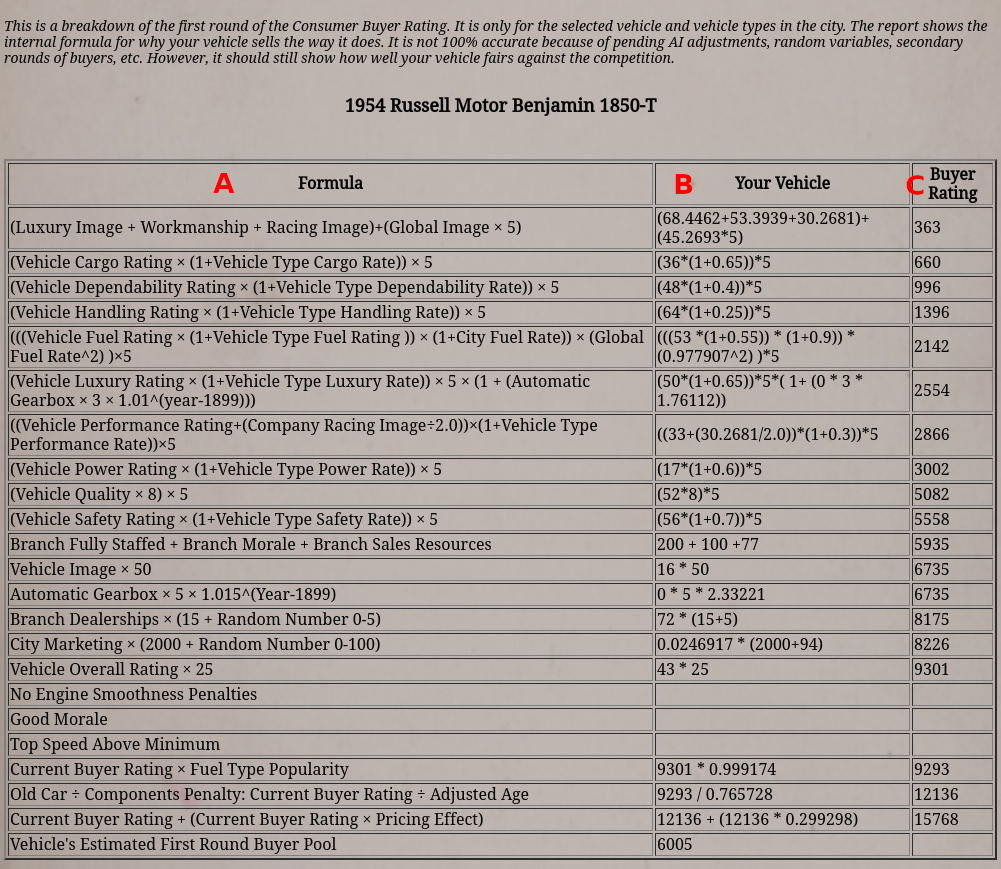
This part of the report is the Buyer Rating Table. This table is the most important tool you have to understand why a vehicle is selling the way it is.
Internally, the game formulates your vehicle offerings into a single variable called a buyer rating. It then uses this buyer rating to compare against other vehicles of the same class, target demographics, and economic demographics. It then distributes sales based on this buyer rating and a few additional details.
This table is nearly the entire buyer rating calculations used in the game. It goes through line by line and displays the numbers used to calculate your buyer rating. It also displays what the buyer rating is at that point in the calculation.
With this data, you can analyze where you are losing buyer rating points. And you can see what parts of the design are giving you more of them.
The table has three columns. Each row in the table is a section of the buyer rating formula. Column A contains the variables and arithmetic for that section of the formula. Column B shows the math for that section of the formula using your vehicle and company numbers. Finally, Column C shows the sum of that row's value and the previous row's buyer rating. Meaning, that Column C of each row is the buyer rating at that point in the buyer rating calculations.
| Formula | Variables | Max Points |
|---|---|---|
| (Luxury Image + Workmanship + Racing) + (Global Image × 5) |
These images ratings are visible in the Prestige and Image reports. | 800 |
| (Vehicle Cargo Rating × (1 + Vehicle Type Cargo Rating)) × 5 |
| 500-1000 |
| (Vehicle Dependability Rating × (1+Vehicle Type Dependability Rate)) × 5 |
| 500-1000 |
| (Vehicle Handling Rating × (1+Vehicle Type Handling Rate)) × 5 |
| 500-1000 |
| (((Vehicle Fuel Rating × (1 + Vehicle Type Fuel Rating)) × (1 + City Fuel Rate)) × (Global Fuel Rate^2))×5 |
| Depends on City And Global Fuel Rate |
| (Vehicle Luxury Rating × (1+Vehicle Type Luxury Rate)) × 5 × (1 + (Automatic Gearbox × 3 × 1.01^(year-1899))) |
| 1900: 2015-4030 2020: 5500-11000 |
| ((Vehicle Performance Rating+(Company Racing Image÷2.0))×(1+Vehicle Type Performance Rate))×5 |
| 750-1500 |
| (Vehicle Power Rating × (1+Vehicle Type Power Rate)) × 5 |
| 500-1000 |
| (Vehicle Quality × 8) × 5 |
| 4000 |
| (Vehicle Safety Rating × (1+Vehicle Type Safety Rate)) × 5 |
| 500-1000 |
| Branch Fully Staffed + Branch Morale + Branch Sales Resources |
| 400 |
| Vehicle Image × 50 |
| 5000 |
| Automatic Gearbox × 5 × 1.015^(Year-1899) |
| 1900: 5 2020: 30 |
| Branch Dealerships × (15 + Random Number 0-5) |
| No Max |
| City Marketing × (2000 + Random Number 0-100) |
| 5343 |
| Vehicle Overall Rating × 25 |
| 2500 |
Low Engine Smoothness |
| -97% |
| No Engine Smoothness Penalties |
| |
Low Morale: |
| -100% |
| Good Morale | Branch morale is good, no penalties. | |
Top Speed Too Slow Vehicle Top Speed ÷ Minimum Top Speed For Vehicle Type |
| -100% |
| Top Speed Above Minimum | The vehicle is fast enough to meet the minimum requirements, so no penalty. | |
| Current Buyer Rating × Fuel Type Popularity |
| ≐ -100% |
| Low Slider Penalty: Current Buyer Rating × Penalty |
| -42% |
Old Car & Components Penalty: Current Buyer Rating ÷ Adjusted Age | This is a penalty for using old designs or selling an old vehicle design.
| ≐ -100% to +23.5% |
| Current Buyer Rating + (Current Buyer Rating × Pricing Effect) |
| |
| Price Gouging Penalty |
| ≐ -100% |
| Quality to Price Ratio Penalty |
| ≐ -100% |
| Neuron Processing Penalty (Hard or Nightmare Difficulty): Current Buyer Rating × 0.95 | The game applies this penalty if you are a human and are playing on Hard or Nightmare mode. Sorry, the AI needs this sort of crutch. | -5% |
| Vehicle's Estimated First Round Buyer Pool | This value is the maximum number of customers interested in purchasing this vehicle after processing the buyer rating. It is not, however, the number of people purchasing the vehicle. That is in the next table. |
Sales Table

Finally, the report will generate the estimated sales figures in the city for all vehicles of this type. The table displays the name of the vehicle, the estimated sales, and the final buyer rating. And it is ordered by the estimated sales. You'll notice that table isn't ordered by buyer rating, but models with higher buyer ratings tend to sell more vehicles than ones with lower buyer ratings. Remember, variables such as the number of dealerships, the amount of marketing, and company image can change the size of the buyer pools of individual models.
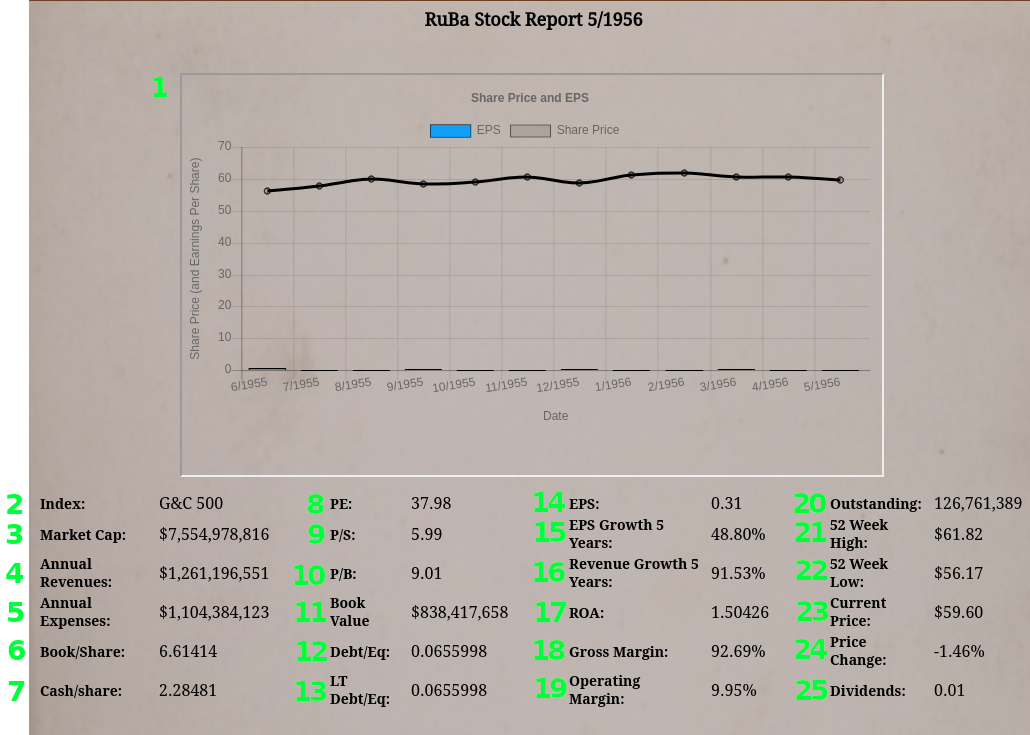
Stock Report

The Stock Report contains additional information about a selected stock. The game generates a Stock Report dynamically, and you can only access it via the Dynamic Report Button located in the Stock Broker window. You can find this button next to the Public Companies header just above the company selection drop-down box.
Report Data
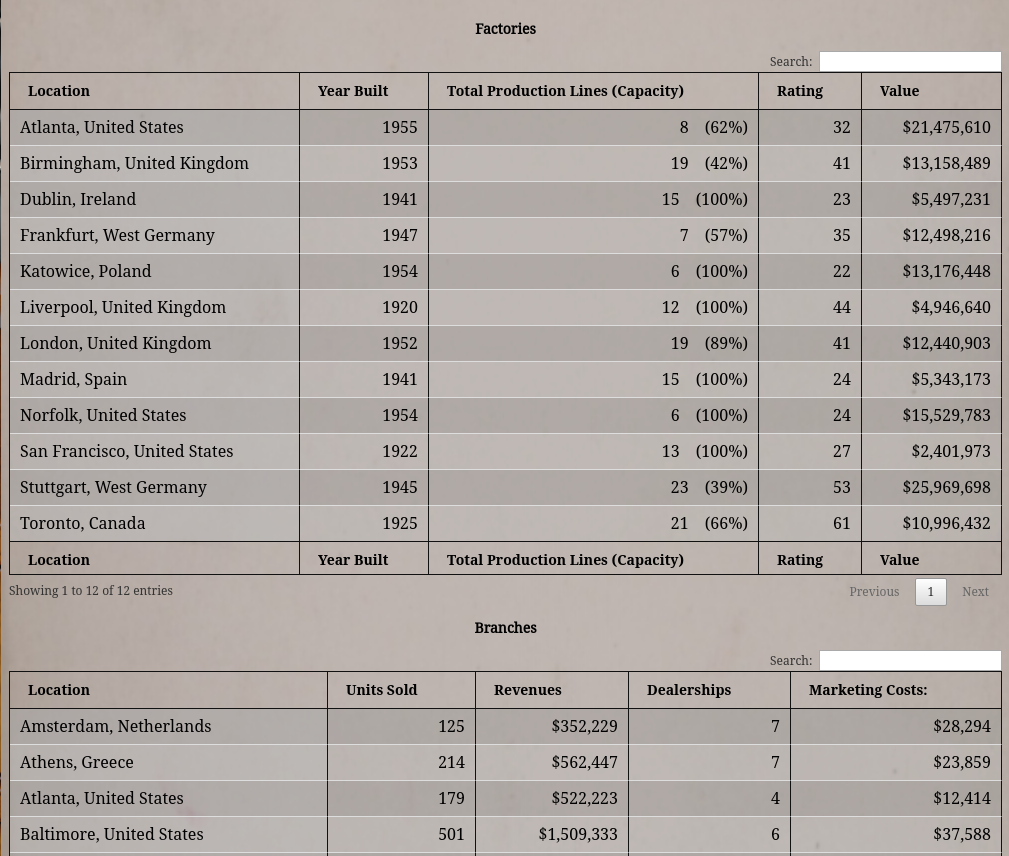
Factory And Branch Table
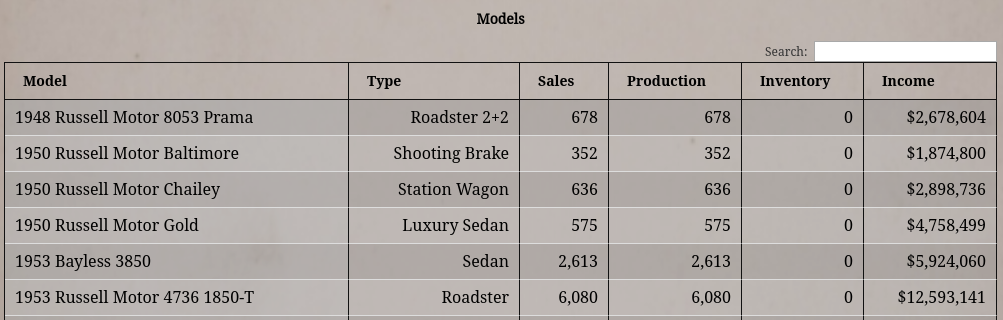
Model Table
Revenues and Expense Chart
