This is an old revision of the document!
Table of Contents
Expense Summary
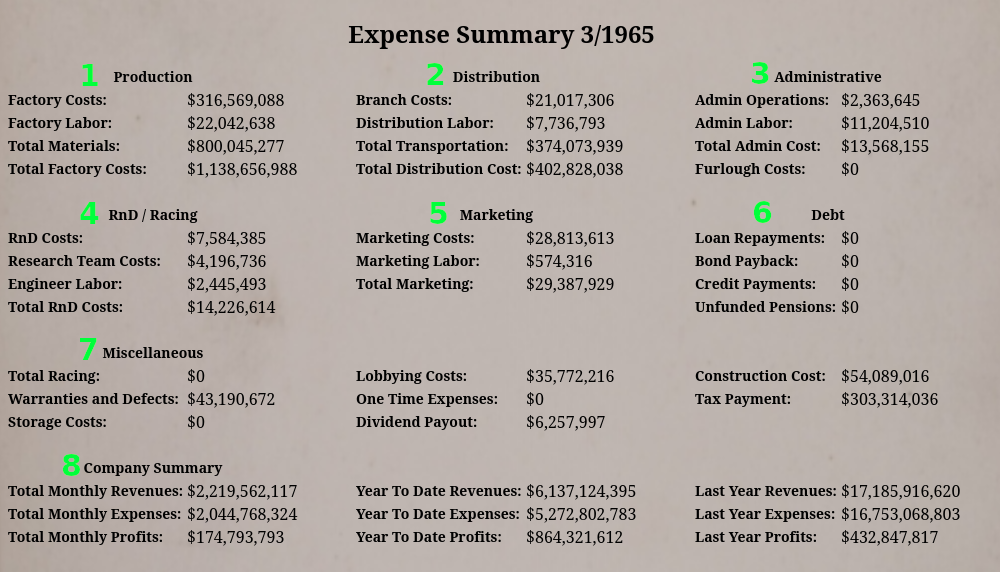
#1 Production
| Category | Description |
|---|---|
| Factory Cost | This amount is the cost to operate and maintain your factory and production lines. |
| Factory Labor | Factory Labor is the amount of money you're paying employees at the factory. |
| Total Materials | Total Material costs are the sum of all material costs for every unit you produce at a factory. |
| Total Factory Costs | This value is all your factory, production line, labor, and material costs. It is the total cost for operating your factories and what comes out of them. |
#2 Distribution
| Category | Description |
|---|---|
| Branch Costs | Branch costs are the total expenses for your branch operations worldwide. |
| Distribution Labor | Distribution Labor is the total amount of money you're spending on labor at your branches. |
| Total Transportation | Total Transportation costs are the total amount you're spending on shipping vehicles from factories to your branches. |
| Total Distribution Cost | This value is the sum of all costs associated with your branches, including operating, labor, and shipping costs. |
#3 Administrative
| Category | Description |
|---|---|
| Admin Operations | Administrative operations are the cost associated with running the administrative functions of your company. |
| Admin Labor | Admin Labor is the labor costs to operate the administrative functions at your company. |
| Total Admin Cost | Total Administrative costs are the sum of your administrative operations costs and your Administrative Labor costs. |
| Furlough Costs | Furlough costs are related to employees which you have idled but have not yet fired. Anytime you reduce labor, those employees will go into a labor pool where they're paid a fraction of their wages. As time progresses, if you do not need more labor, these employees will leave the furlough pool. |
#4 RnD/Racing
| Category | Description |
|---|---|
| RnD Costs | This value is the monthly amount you're spending on researching new designs. |
| Research Team Costs | This is your monthly budget for all independent research teams. |
| Engineer Labor | Here are the labor costs associated with designing new designs, operating research teams, and the labor costs associated with running racing teams. |
| Total RnD Costs | This value is the summation of all research costs, including designs, budgets, and labor. |
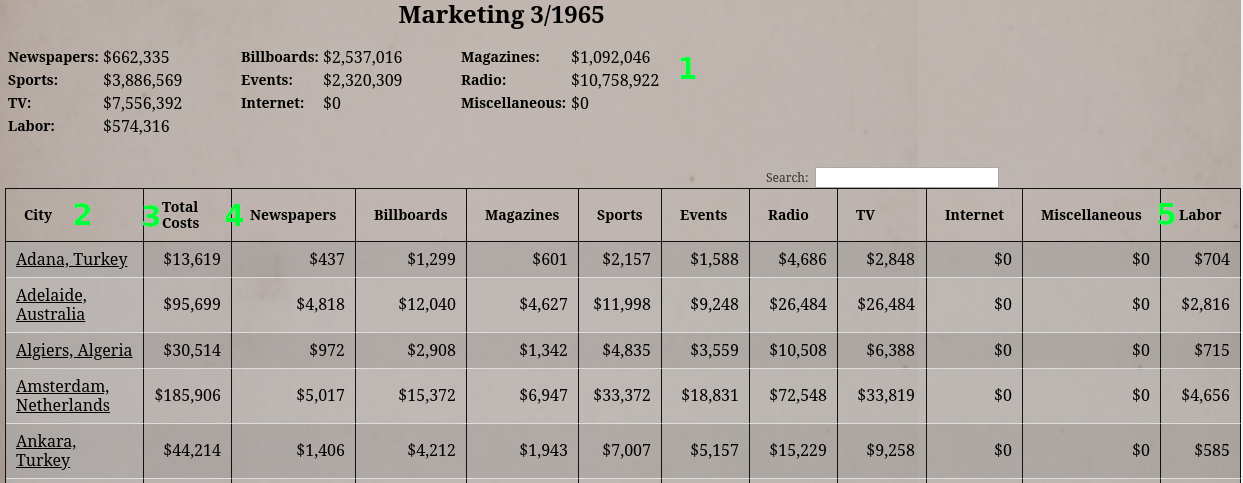
#5 Marketing
| Category | Description |
|---|---|
| Marketing Costs | Marketing costs are the total budgets you're spending on marketing each month. |
| Marketing Labor | Marketing Labor is the amount you're spending on labor for your marketing efforts. |
| Total Marketing | This is the total marketing budget and labor expenses each month. |
#6 Debt
| Category | Description |
|---|---|
| Loan Repayments | This is your total monthly loan repayments. |
| Bond Payback | Bond coupon and maturity payments are here. |
| Credit Payments | Payments made to your line of credit shows here. |
| Unfunded Pensions | If your pensions are underfunded, your company will have to make up the difference. This value is the amount you're paying each month because of underfunded pensions. |
#7 Miscellaneous
| Category | Description |
|---|---|
| Total Racing | This is the total amount you're spending on racing budgets. It does not include labor, which you'll find in the “Engineer Labor” line. |
| Warranties and Defects | Warranties contain the expenses from parts failures on vehicles three years old or newer. The game generates this value from the number of vehicles you sold, the dependability rating of the vehicle, and the unit costs of the vehicles. After 3 years, failed parts become OEM Part Revenues instead of being covered by warranties. |
| Storage Costs | Storage Costs are the cost to store vehicle excess inventories at your factories. |
| Lobbying Costs | Lobbying Costs is your lobbying budget. |
| One Time Expense | One-Time Expenses cover expenses made from game events and other one-off actions. |
| Dividend Payout | Dividend Payout is the amount of money you’re paying out in dividends each month. |
| Construction Costs | This is the factory and branch construction costs for the month. |
| Tax Payment | This is the amount in taxes you paid this month. Major taxes happen quarterly. If you overpay your taxes for the fiscal year, you will get a refund for the amount overpaid. |
#8 Company Summary
| Category | Description |
|---|---|
| Total Monthly Revenue | This is the total revenues your company made last month. |
| Total Monthly Expenses | Here is the total expense your company accrued last month. |
| Total Monthly Profits | This is the difference between the revenues and expenses last month. |
| Year To Date Revenues | Here you'll find your revenues year to date. |
| Year To Date Expenses | Your expenses year to date. |
| Year To Date Profits | This is the difference between year-to-date revenues and year-to-date expenses. |
| Least Year Revenues | This is the total revenues your company last year. |
| Least Year Expenses | Here is the total expense your company accrued last year. |
| Least Year Profits | This is the difference between the revenues and expenses last year. |
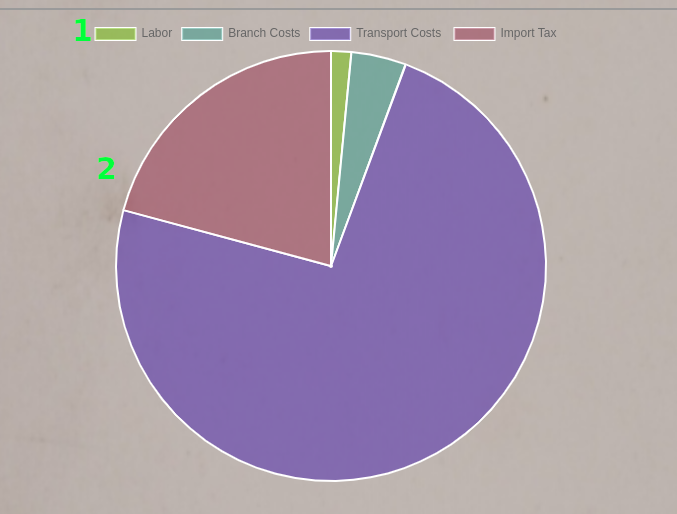
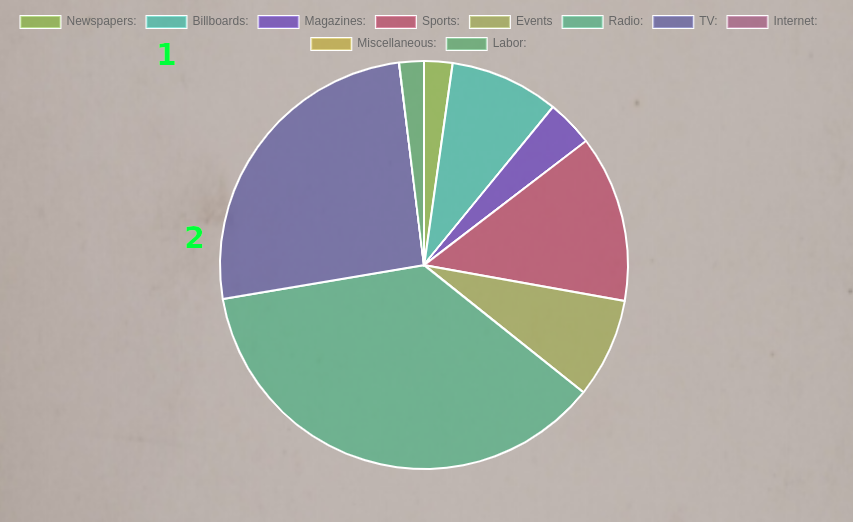
Charts
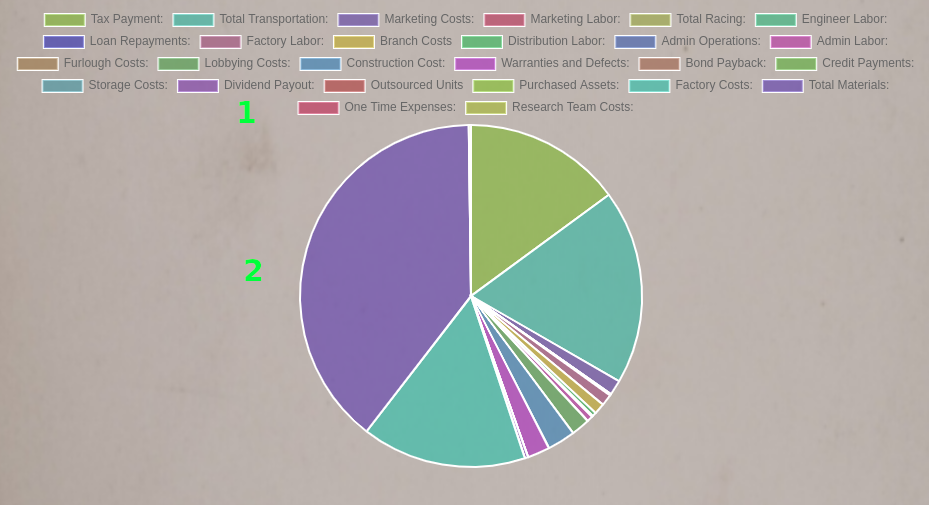
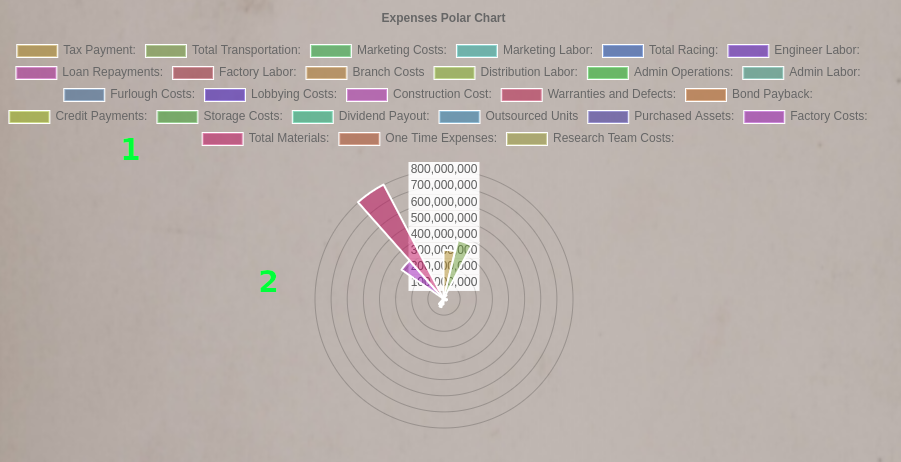
The report also contains two charts, an Expense Radio Chart and a Expense Pie Chart. Both charts display all your expenses in the graphs (#2). Above the graphs are colored blocks (#1). These blocks correspond to the colors on the graphs. You can click these blocks to toggle the display of this category in the chart.
Factory
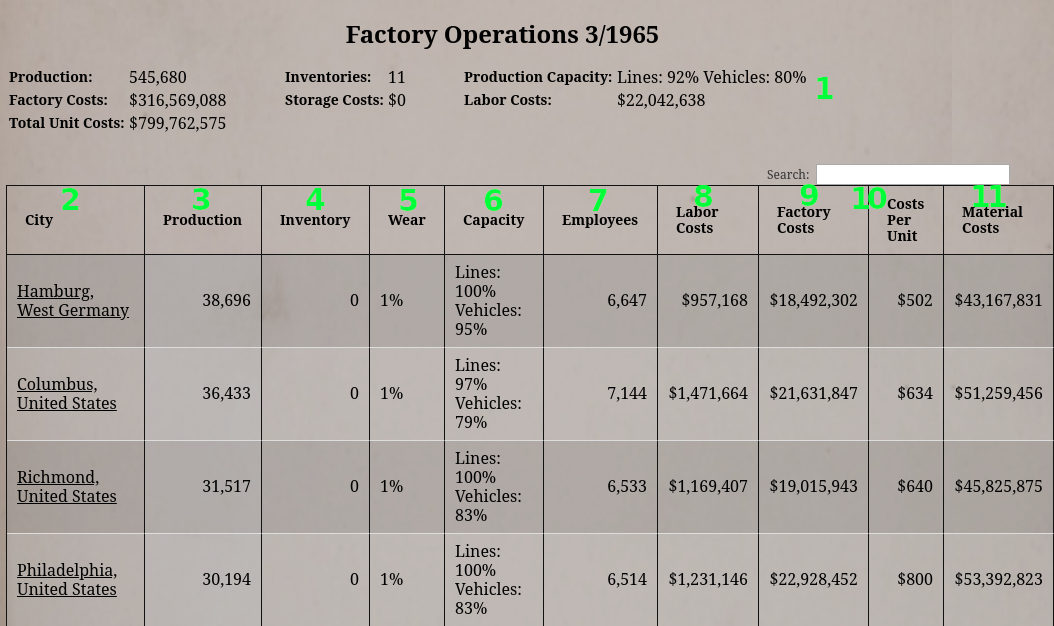
The Factory Operations report contains summary information about your factories and information about every individual location you operate.
At the top of the report is the summary information about all your factories (#1). This section shows the total number of vehicles you produced, how many you have in inventories, and the percentage of production capacity you are using.
The top section also summarizes costs associated with your entire factory operations.
Below the summary is a table containing your individual factories and information about them. The first column is the factory's location (#2). The underlined text are links, and you can click them to go to the Selected City Sales report for that city. You can find the number of vehicles you produced at this location in the next column (#3) and the number of vehicles in inventory next to that (#4).
Over the years, factories wear down. Eventually, wear will slow down your production output. The game will let you know when it starts to affect production with an action memo. You can find the wear amount in the wear column (#5).
Capacity (#6) shows the number of lines used and the utilization of those lines as percentages. The Line percentage refers to the number of factory lines that are in use. The Vehicles percentage displays the production speed utilization of those lines.
The Employees column (#7) displays the number of employees working at this factory, and the Labor Cost column (#8) shows the monthly cost to employ them. You can find Factory operation costs in the Factory Costs column (#9). And the Factory Costs and Labor Costs per unit produced at the factory are displayed in the Costs Per Unit column (#10). Lastly, the material costs of all vehicles produced at the factory are in the final column (#11).
Charts
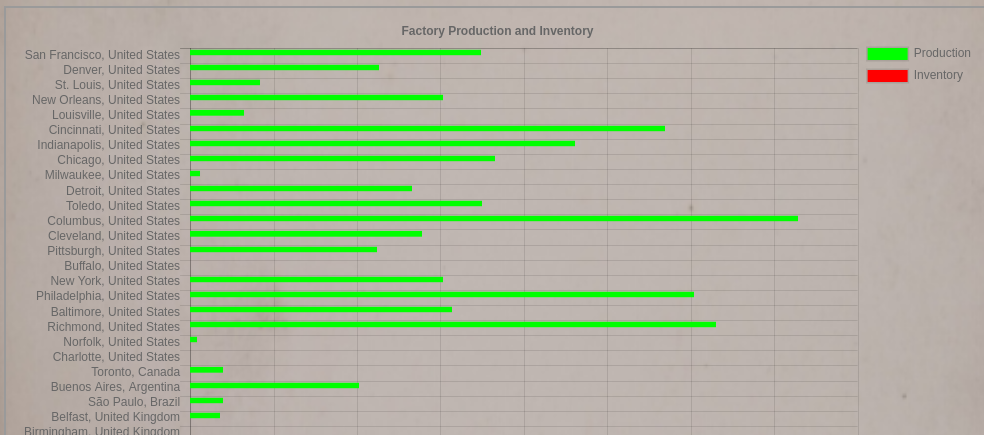
This report contains a bar graph showing each location and displays the factory production amount and inventory levels.
Branch
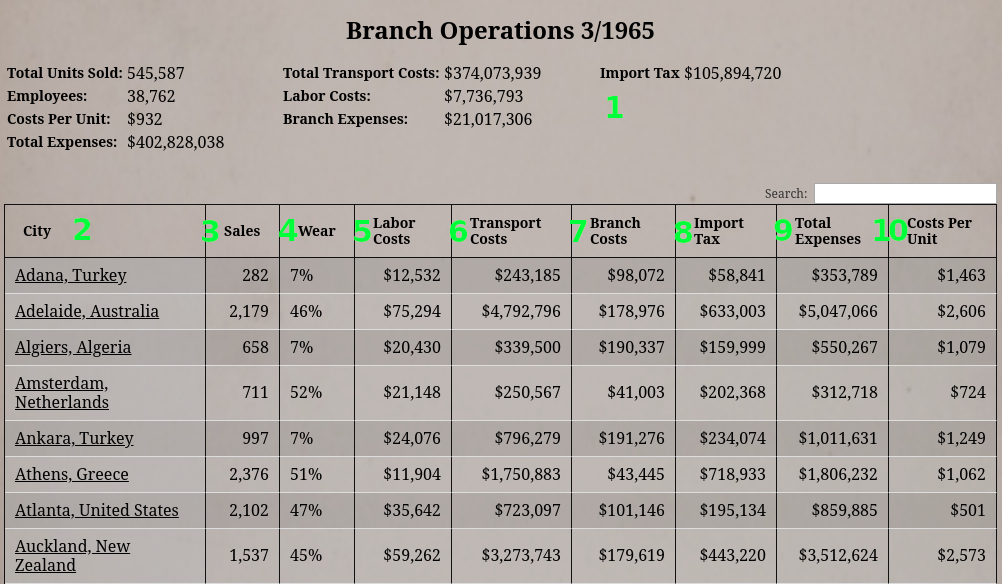
The Branch Operations report contains summary information about your branches and information about every individual location you operate.
At the top of the report is the summary information about all your branches (#1). This section includes the total number of vehicles you sold and how many people you employ. It also shows your total expenses and breaks that value down into several categories.
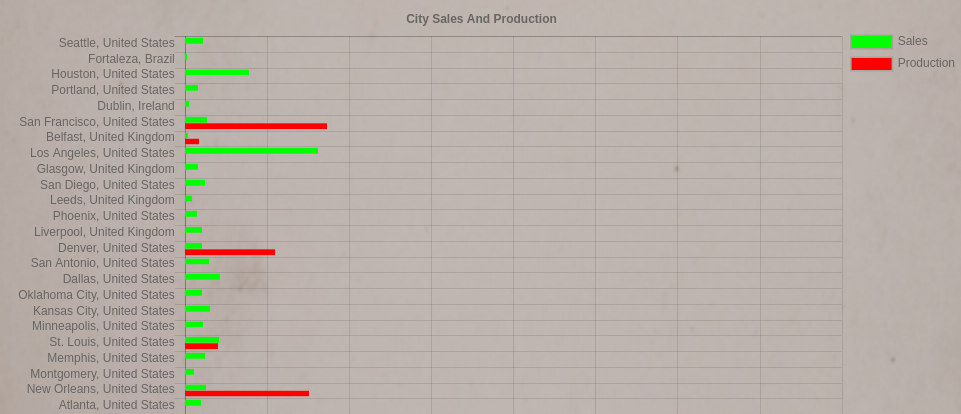
Charts
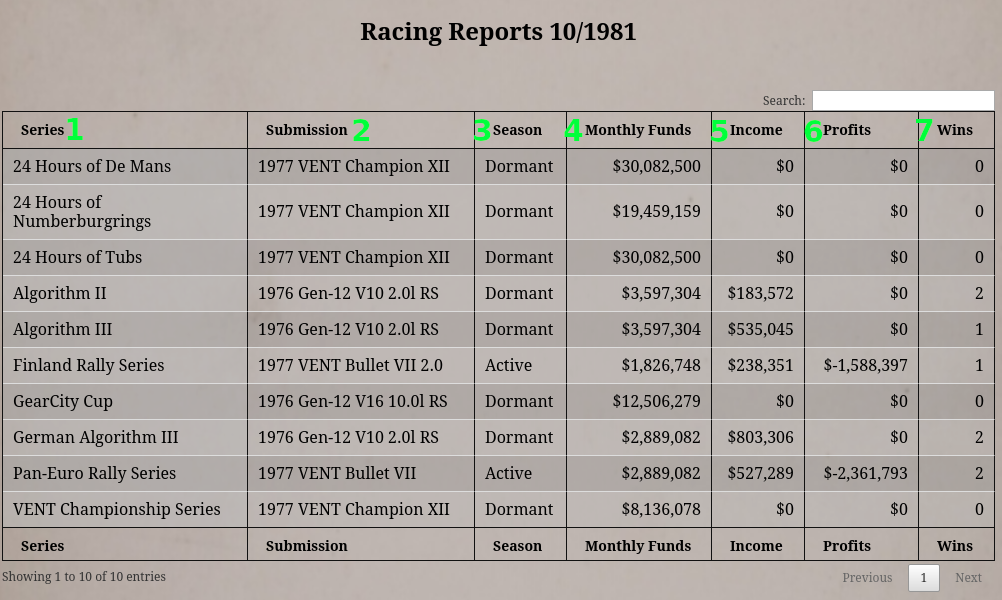
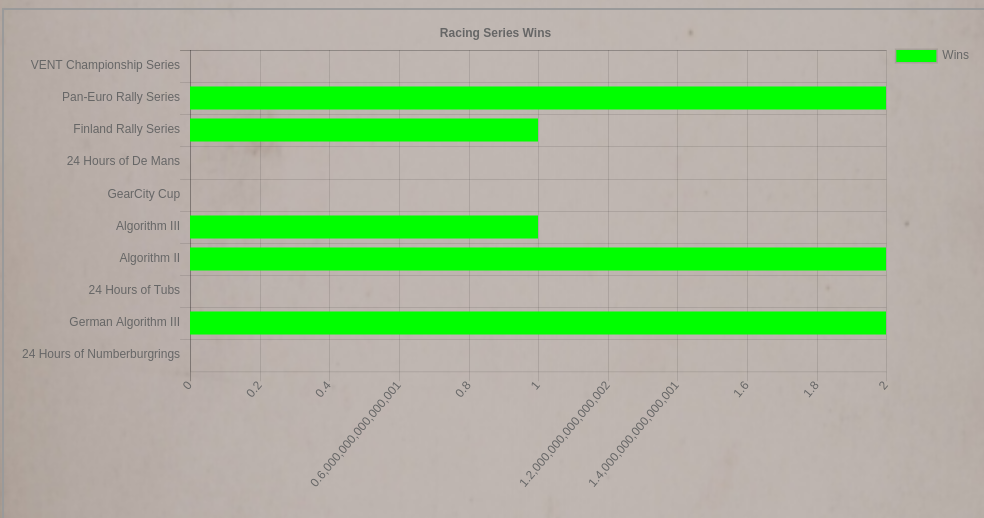
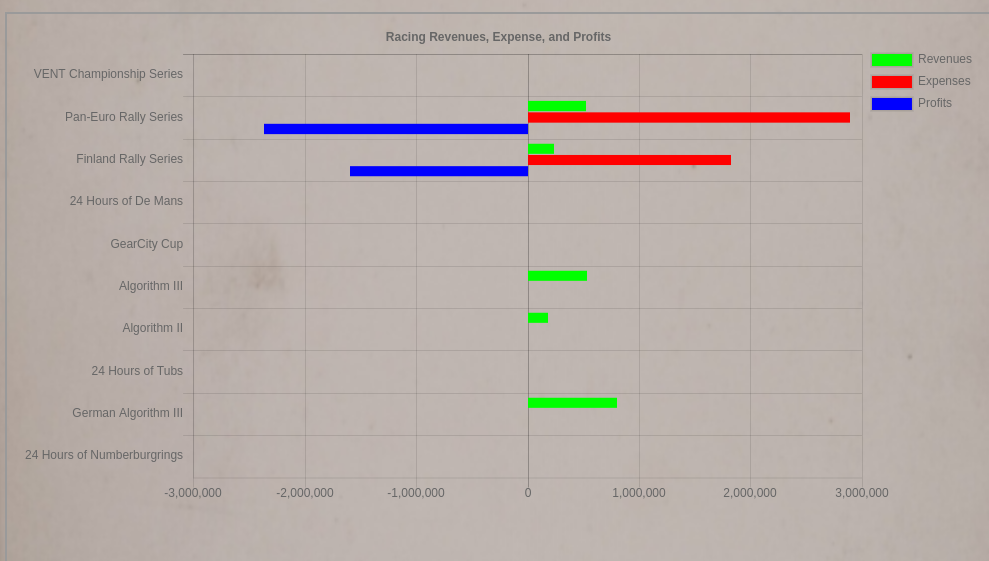
Racing
Charts
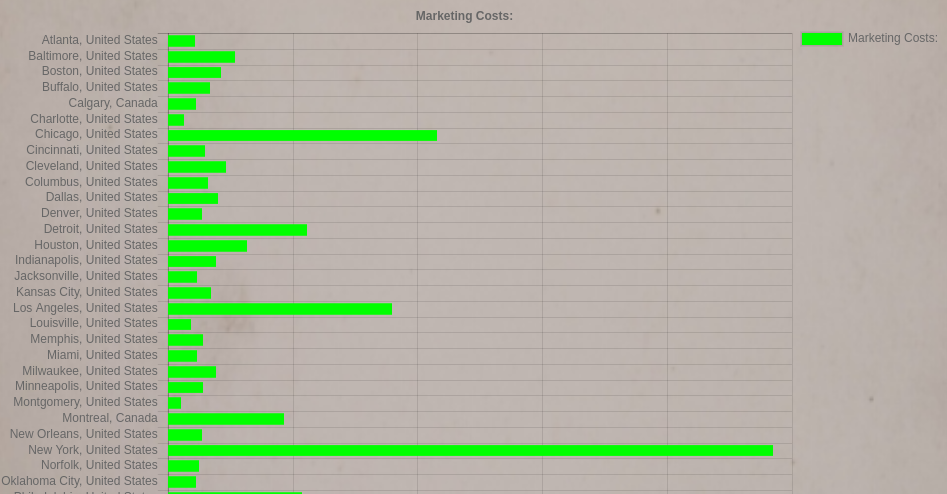
Marketing
Charts
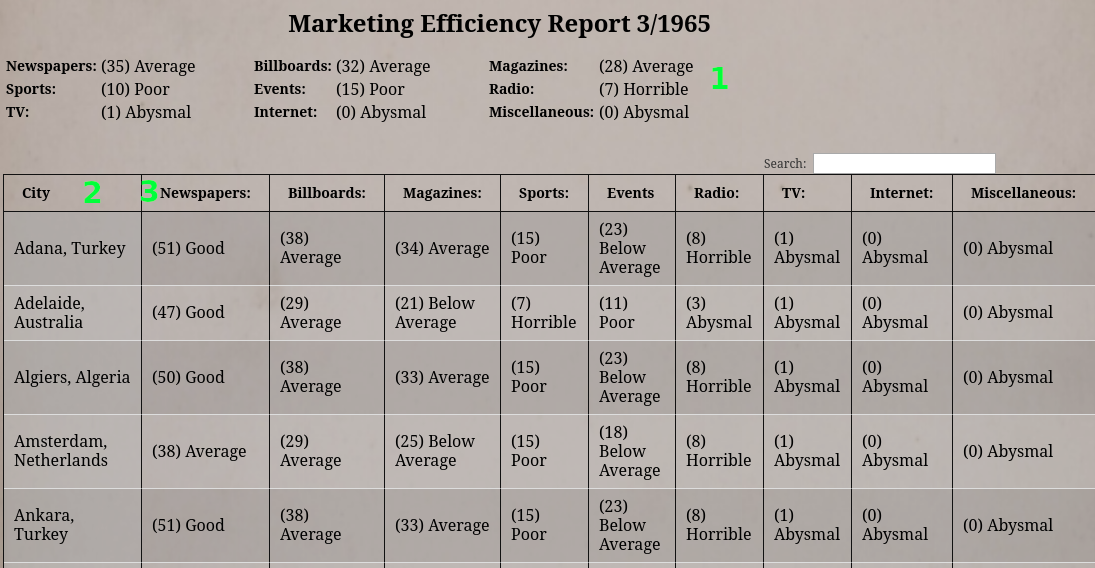
Marketing Efficiency
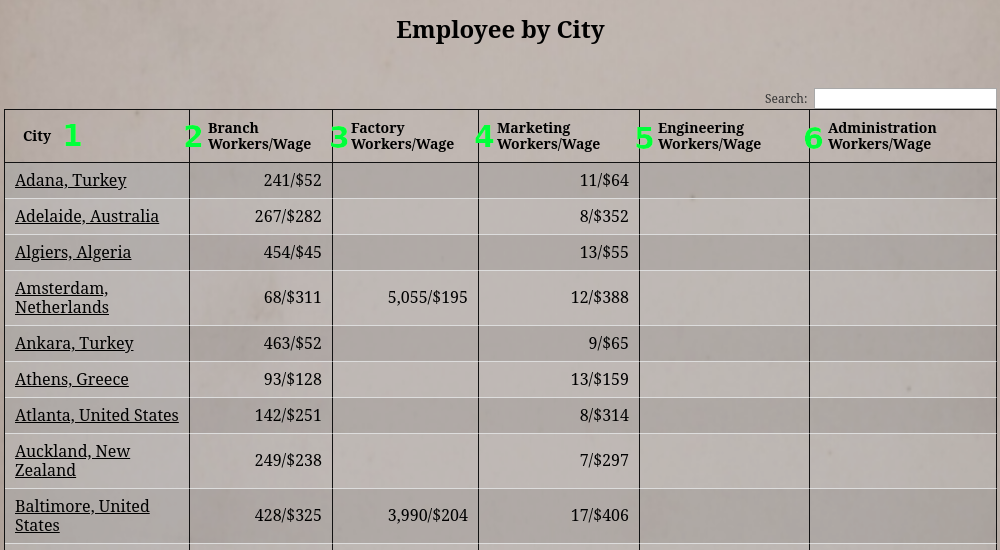
Employee Breakdown
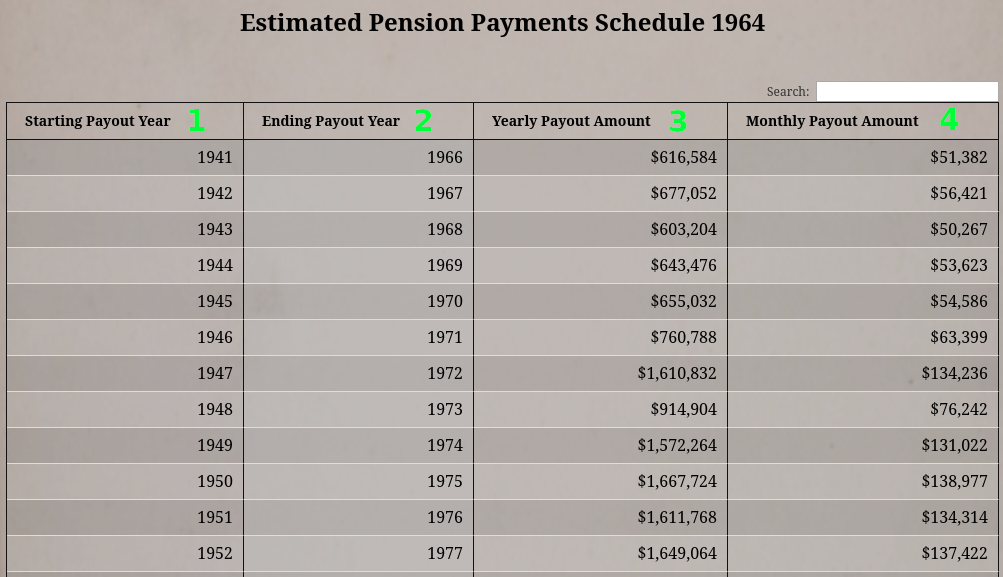
Pension Payment
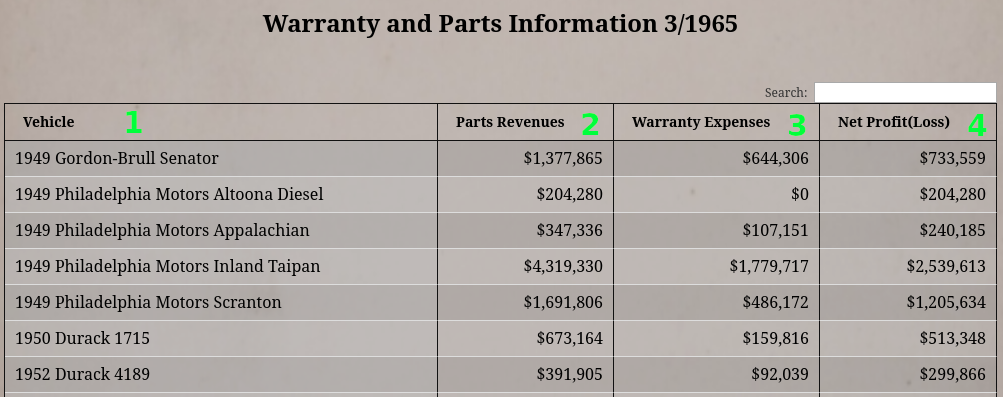
Warranties And Parts
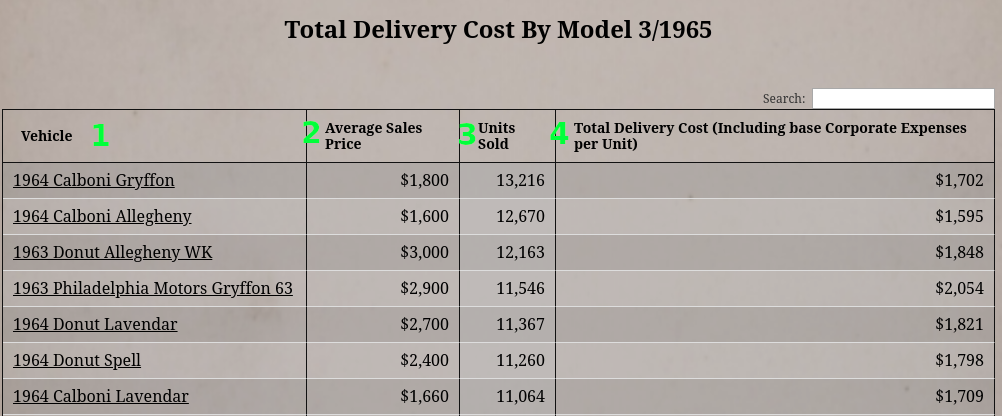
Total Delivery Cost
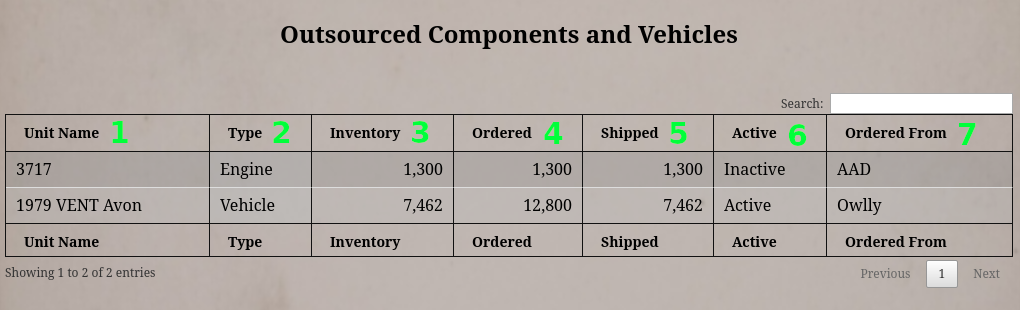
Outsourced Contracts