
Table of Contents
Video Tutorials
All Time Market Share
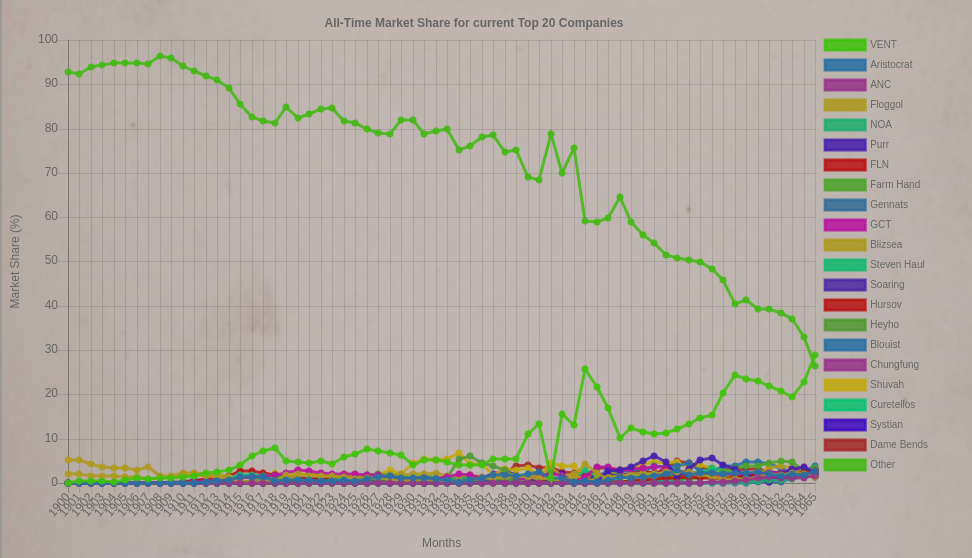
The All-Time Market Share chart displays a market share history graph of the top 20 companies, your companies, and a summation of all other companies. Clicking any of the colored boxes on the right side of the chart will remove that entry from the graph.
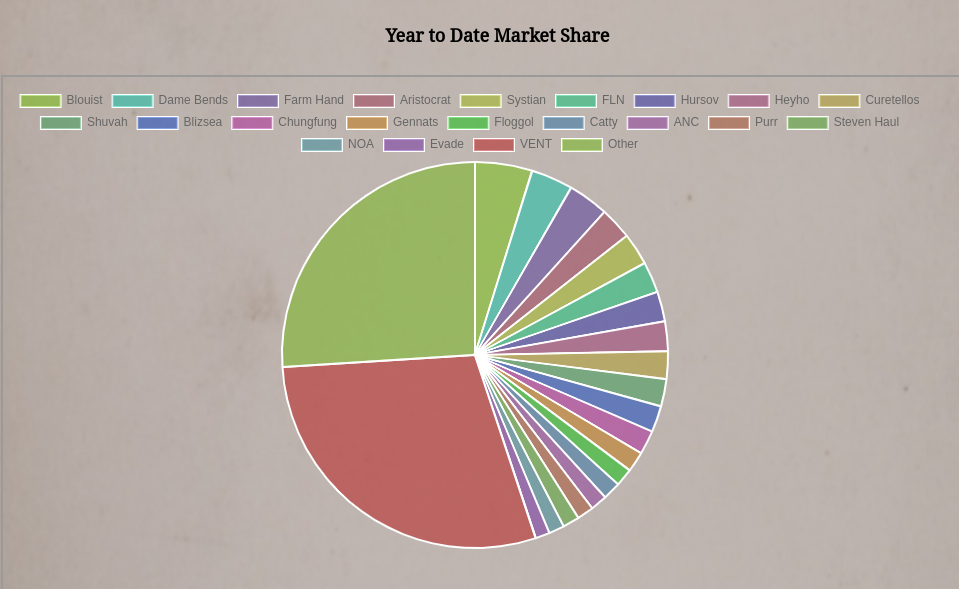
Recent World Market Share
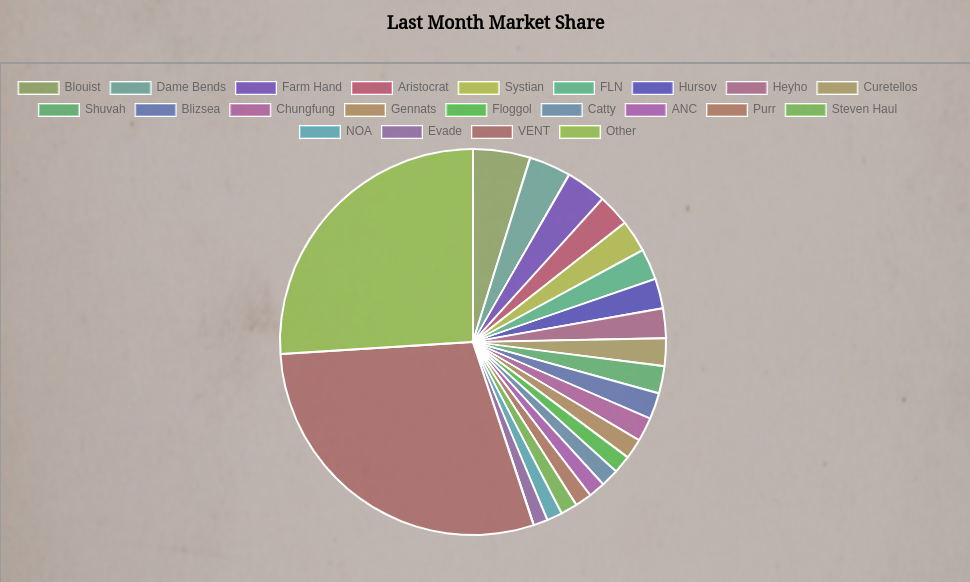
The Recent World Market Share chart contains two different graphs. The top graph is last month's market share for the top 20 companies, your company, and a summation of all other companies. At the bottom is a year-to-date market share graph containing the top 20 companies, your company, and a summation of all other companies. You can click the colored boxes at the top to remove an entry from the charts.
Monthly Revenues, Expense, and Cash Flow
The Monthly Revenues, Expenses, and Cash Flow charts give you two interesting ways to view your company's financials.
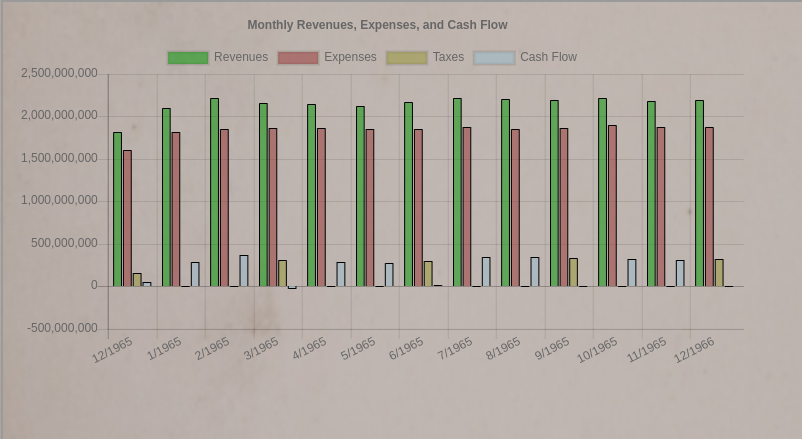
The bar chart provides monthly revenues, expenses, cash flow, and tax payments in one graph.
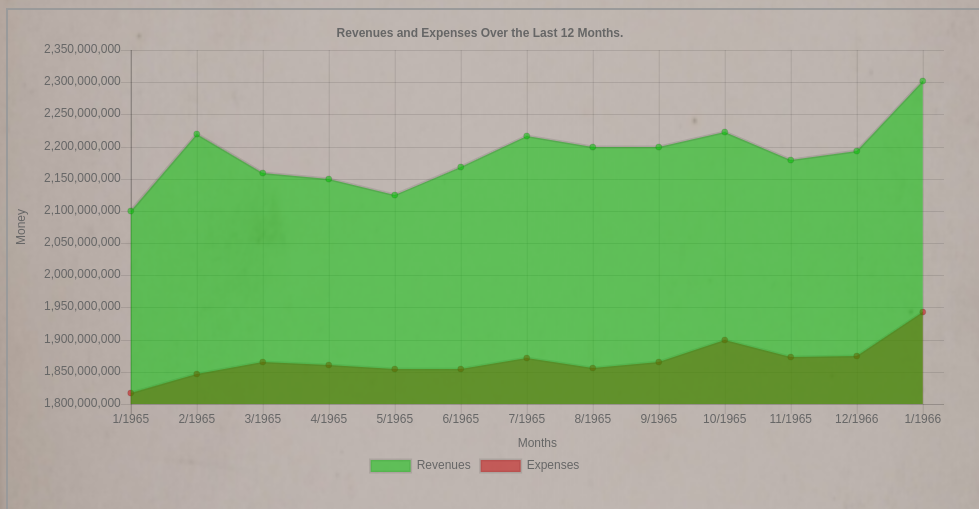
The line chart transparently overlays your monthly revenues over top of your expenses. This chart is a great way to visualize your profit margins.
Yearly Profits/Losses
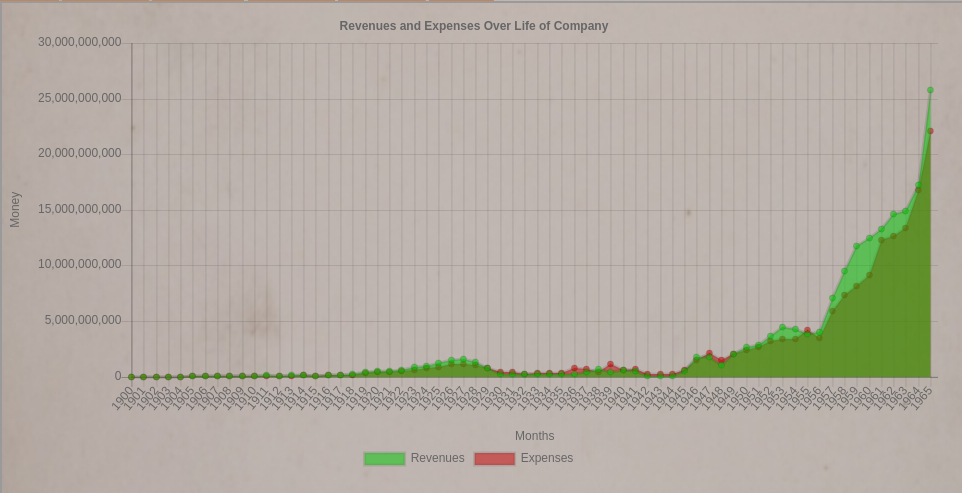
The Yearly Profits/Losses chart overlays a revenues line graph over top of an expense line graph. It's a great way to visualize the financial success of your company over the years.
Vehicle Sales Charts
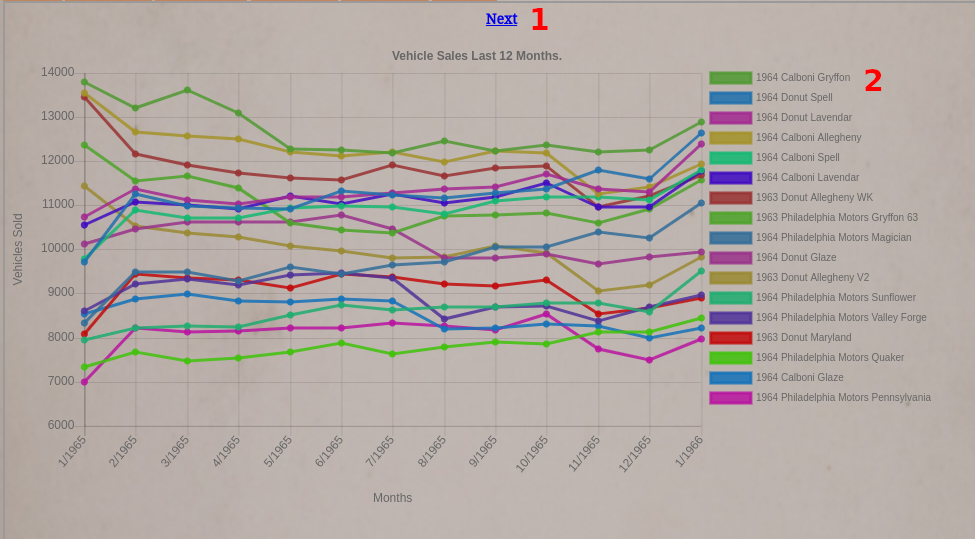
The Vehicle Sales Charts comes with two graphs showing your vehicle sales over time. The first chart shows your active vehicle sales over the last twelve months.
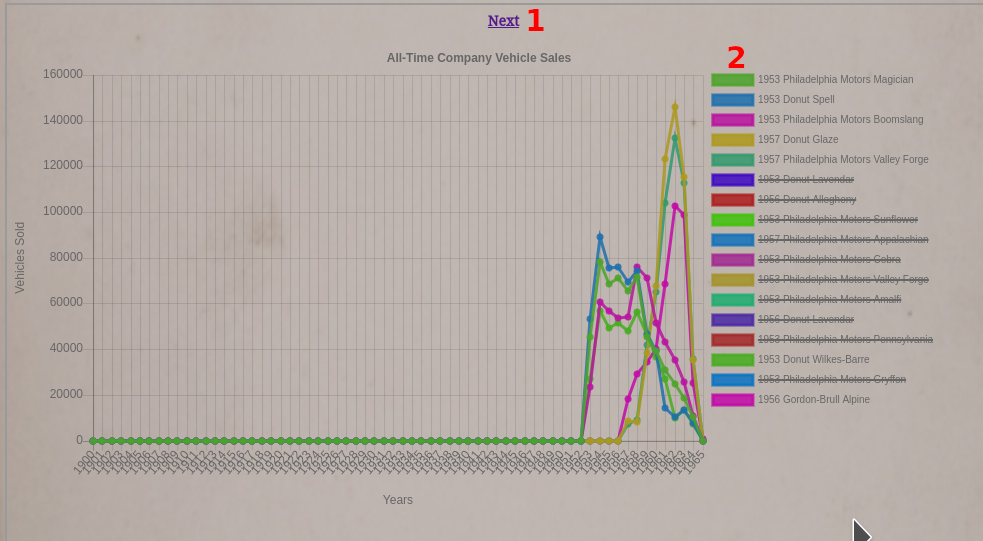
The bottom graph shows all your vehicle sales throughout history. By default, the game does not display inactive vehicle models. You will need to toggle them on to display them.
At the top of both of these reports is a “Next” link (#1). This link will take you to additional pages with more vehicles on them. Additionally, you can click the colored blocks on the side (#2) to enable or disable an entry on the graph.
Networth
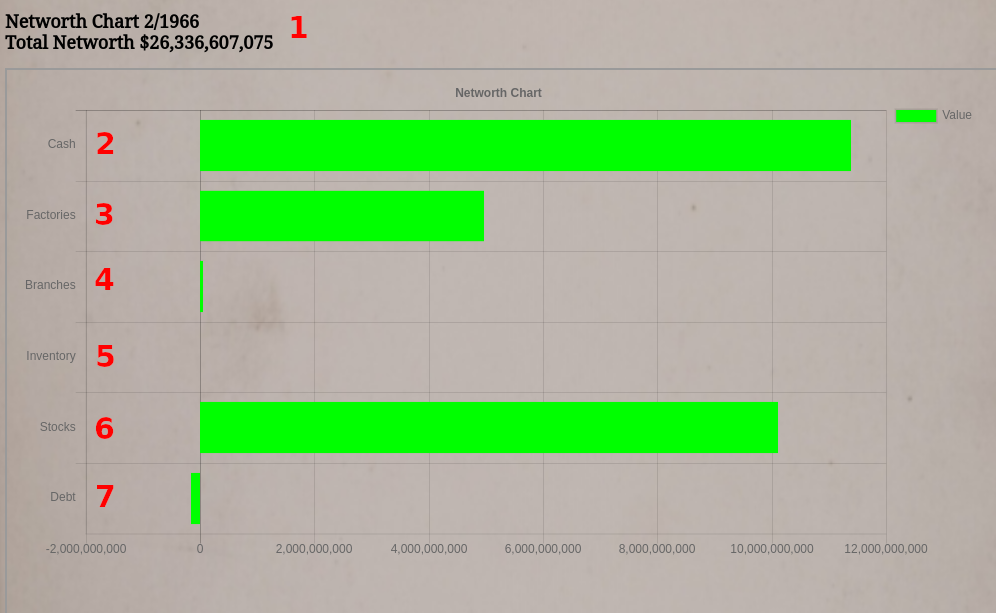
The Networth Graph displays the book value of your holdings in particular assets. It also shows your debt load.
- This is your company's total net worth/book value.
- This is the amount of cash you have.
- This is the value of your factories.
- This is the value of your branches.
- This is the value of all vehicles you have in inventory.
- This is the value of all stocks you hold, not including your own.
- This is the amount of money you owe.