
Table of Contents
Reports
There are several ways to access the main reports system. To access these reports, you can click the “Reports” button from the top menu. The pile of papers on your Office desk also works. The main reports appear at the start of every turn if the setting is enabled.
![]()
There are also multiple dynamically generated embedded reports throughout the game. You'll find them anywhere this button is present. We cover them in detail on the Dynamic Reports page.
Main Reports
The Main Reports contain all reports the game generates when you end the turn. Most of these reports have to do with your sales, revenues, and expenses. They also contain reports based on information the game needs to process sales, such as vehicle popularity. You can control which reports the game generates using the settings from the Office report window.
Below is are tables listing each report contained in the main reports and the information it provides.
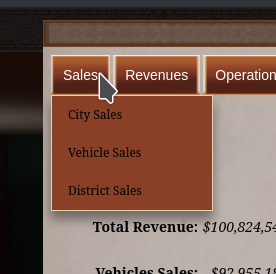
Sales
Video Tutorials: Sales and Production Reports (Youtube)
| Name | Description |
|---|---|
| City Sales | This report contains a table with the total sales, production, missed sales, expenses, and revenues for each city you’re operating in. Clicking any of the underlined cities will take you to the Selected City’s Sales and Production page. |
| Vehicle Sales | This report is similar to the one found in the monthly report. It contains a table with the total sales, production, reserves, and missed sales of each of your vehicle models, and has additional Revenues and Material Costs as well. Clicking any of the underlined vehicles will take you to the Selected Vehicle's Sales and Production page. |
| District Sales | This report contains a table with total sales, production, inventory, missing sales, and revenues for regional and custom districts. |
Revenues
Video Tutorials: Income Reports (Youtube)

| Name | Description |
|---|---|
| Revenue Summary | This report contains much of the same information found in the Monthly report, but it has an additional polar and pie graph. |
| Licensing Revenues | This report contains a more detailed breakdown of your licensing revenues. |
| Contract Revenues | This report is similar to the Licensing Revenues report, except it shows Contracts and Outsourced sales instead. |
| Stock Holdings | This report lists your current stock holdings and how much they’re worth. |
| Dividend Revenues | This report contains a table with each stock you own, how many shares you own, the dividend payout rate, and how much revenues you make from those dividends. |
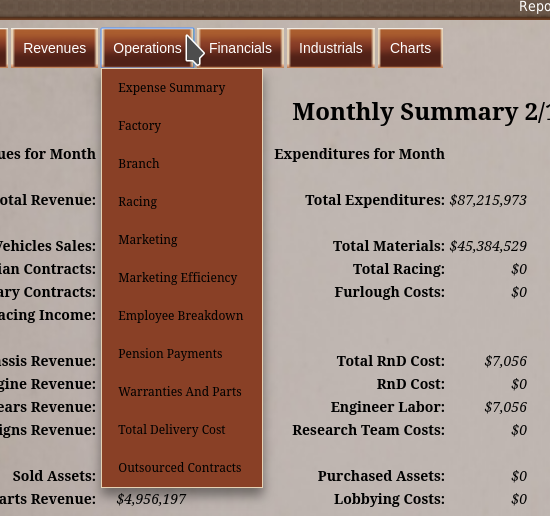
Operations
Video Tutorials: Expense Reports (Youtube)
| Name | Description |
|---|---|
| Expense Summary | This report contains the same information as the monthly report, but it also includes year to date and last year's revenue, expense, and profits information. |
| Factory | This report has a detailed listing of your factory expenses, it is a great report to monitor your factory production capacity when you are using Auto Production or have a large company. |
| Branch | This report is like the Factories Operations report. The top contains total units sold, total branch employees, and totals for all your branch-related expenses. |
| Racing | This report lists every racing series you’re active in, and your budget per month. |
| Marketing | The top of this report contains your total marketing expenses, broken down by each marketing category. |
| Marketing Efficiency | The Market Efficiency report shows how well your marketing efforts are doing for each class of marketing. |
| Employee Breakdown | This report is a table listing each city you operate in, how many employees you have in each employment category, and the average wages you’re paying. |
| Pension Payment | This report contains your pension payout table. The game groups retirees based on the year they retire. And this report shows you how much you'll pay them per year. |
| Warranties And Parts | This report lists every vehicle still receiving parts revenues or warranty expenses. |
| Total Delivery Cost | This report shows the Total Delivery Costs of each vehicle calculated for last month. |
| Outsourced Contracts | This report is a table that lists active outsourced components and vehicles you are purchasing from another manufacturer. |
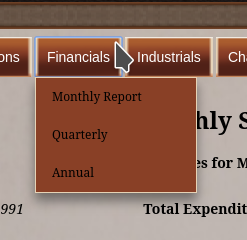
Financials
Video Tutorials: Monthly Sales Report (Youtube)
| Name | Description |
|---|---|
| Monthly Report | The monthly report is the default report of the reports system. It contains revenues, expenses, and a vehicle production and sales table. This is the most important report in the game. |
| Quarterly | The Quarterly Report displays your financial results for the quarter and compares those results with last year's results. This report is updated every three months. |
| Annual | The Annual Report displays your financial results for the year and compares those results with last year's results. This report is updated once a year. |
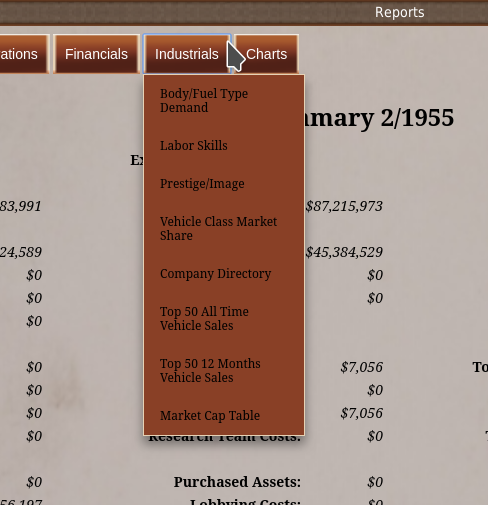
Industrials
Video Tutorials: Rating Reports (Youtube) • Data Reports (Youtube)
| Name | Description |
|---|---|
| Body/Fuel Type Demand | This is one of the most important reports in the game. It contains two tables, one which shows the regional popularity of vehicle types. The other showing fuel type's popularity. |
| Labor Skills | This report lists your company and any marques you own. It shows the skill ratings of these companies. |
| Prestige/Image | The Prestige and Image ratings are how the public view certain parts of your company. |
| Vehicle Class Market Share | This report shows each vehicle type in the game, the company that has the most market share in the class, and your company's market share. |
| Company Directory | This report lists every company in the game, along with their revenues, expenses, and funds. |
| Top 50 All Time Vehicle Sales | This report shows the top 50 best-selling vehicles of all time. |
| Top 50 12 Months Vehicle Sales | This report shows the top 50 best-selling vehicles over the last 12 months. |
| Market Cap Table | This report lists every publically traded company in the game, along with their share price and market cap. |
Charts
Video Tutorials: Charts Report (Youtube)
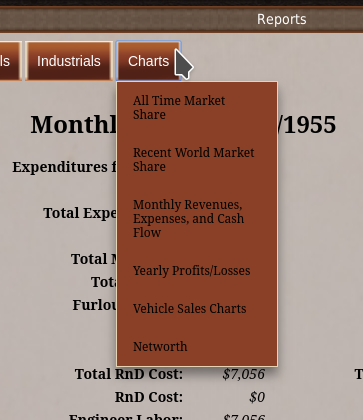
| Name | Description |
|---|---|
| All Time Market Share | This report shows the current top 20 companies, your company, and the summation of all other companies. |
| Recent World Market Share | This page contains two charts. The top chart is a piechart showing last month’s market share for the top 20 companies, your company, and the sum of all other companies. |
| Monthly Revenues, Expense, and Cash Flow | This report contains two charts. One chart shows the Revenues, Expenses, Taxes, and your Cash Flow over the last 12 months. The other is a line graph of Revenues and Expenses over the last 12 months. |
| Yearly Profits/Losses | This chart shows the Revenues and Expenses over the life of your company. |
| Vehicle Sales Charts | This report contains two charts, a Vehicle Sales Over The Last 12 Months. And an All-Time Vehicle Sales chart. |
| Networth | This chart is a simple horizontal bar chart displaying your net worth, broken down into six categories. |